Advertisements
Advertisements
Question
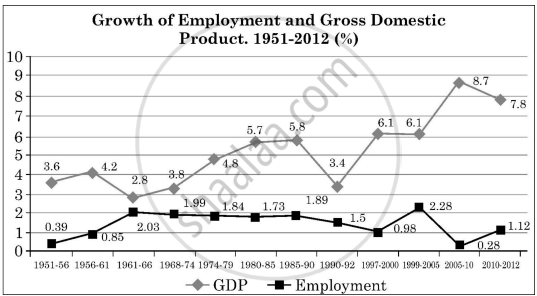
Study the following chart of employment and gross domestic product. Analyse the trend of the two variable between 1990-2012.

Solution
India has seen jobless growth, meaning that the employment rate is not rising as quickly as the GDP growth rate, according to the trend in the employment and GDP chart. This is contributing to India's severe unemployment issue. Between 1990 and 2012, the employment growth rate fell from 1.89% in 1990 to 1.5% in 1990-92, then from 1.5% in 1997 to 0.98% in 1997-2000, and finally, after a slight recovery in 1999-2005, to 0.28% in 2005-10. On the other hand, the GDP has been growing steadily, rising from 3.8% to 7.8% between 1990 and 2012. This suggests that although India's GDP is growing, job levels are barely growing, which contributes to the country's increasing poverty rates.
