Advertisements
Advertisements
Question
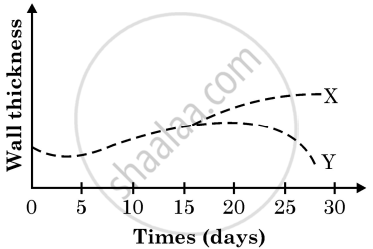
Study the graph given below that represents the changes in the thickening of the uterine wall in women ‘X’ and women ‘Y’ over a period of one month:

What does the graph with respect to woman ‘X’ and woman ‘Y’ indicate? Give suitable reason.
Give Reasons
Solution
- If the egg doesn't get fertilized after ovulation, which usually happens around the 14th day of the monthly cycle, the lining of the uterus is shed during menstruation, which happens every 28 days But if fertilisation happens, the lining of the uterus gets thicker to support the growing baby.
- The image shows that after 14 days, woman Y's uterine wall starts to get thinner, which means the egg has not been fertilised. On the other hand, woman X's uterus wall starts to get thicker, which means the egg has been fertilised and she is now pregnant.
shaalaa.com
Is there an error in this question or solution?
