Advertisements
Advertisements
Question
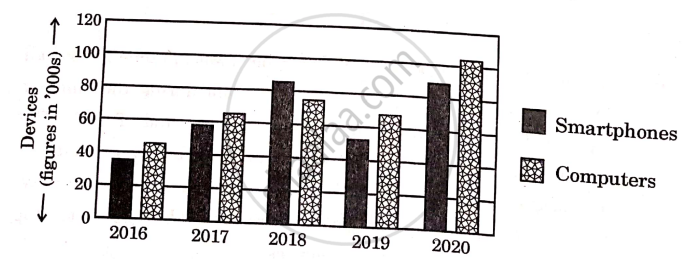
The bar chart below shows data about the number of digital devices purchased in Sahibabad across the years 2016-20. Write a paragraph analyzing the given data in 100-120 words.

Solution
The given bar chart represents the number of digital devices, specifically smartphones and computers, purchased in Sahibabad from 2016 to 2020. It is evident that both categories showed an increasing trend over the years. In 2016, the sales of smartphones were slightly higher than computers, with around 30,000 smartphones and 25,000 computers sold. The upward trend continued in 2017, with smartphone purchases reaching approximately 50,000, whereas computer sales were slightly lower. The peak for smartphones was in 2018, where sales exceeded 90,000, while computers lagged behind at nearly 70,000. In 2019, smartphone purchases declined slightly but still remained higher than computers. However, in 2020, the highest sales were recorded for both devices, with computers surpassing smartphones for the first time, exceeding 100,000 units. This indicates a growing preference for computers in recent years, possibly due to increased demand for remote work, education, and digital activities. The overall trend suggests rapid technological adoption in Sahibabad, with an increasing number of people investing in digital devices.
