English

The Column Graph, Given Above, Shows the Number of Patients, Examined by Dr. V.K. Bansal, on Different Days of a Particular Week. - Mathematics

Advertisements
Advertisements

Question

The column graph, given above, shows the number of patients, examined by Dr. V.K. Bansal, on different days of a particular week.

Use the graph to answer the following:

On which days were equal number or patients examined?

Graph
One Line Answer

Solution
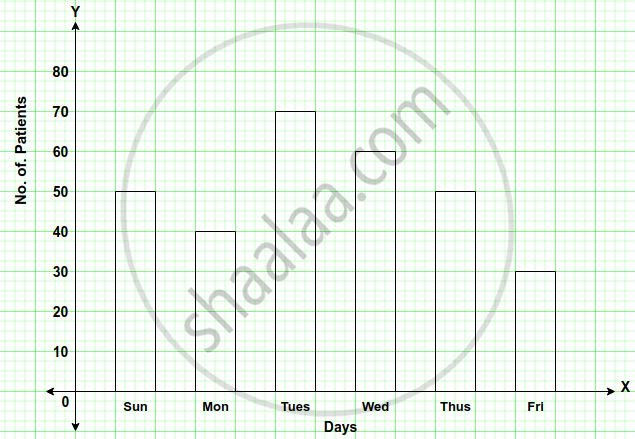
Sunday and Thursday were equal number of patient examined.

shaalaa.com
  Is there an error in this question or solution?
Chapter 33: Data Handling (Including Pictograph and Bar Graph) - Exercise 33 (C)

APPEARS IN

Selina Mathematics [English] Class 6
Chapter 33 Data Handling (Including Pictograph and Bar Graph)
Exercise 33 (C) | Q 9.3
Share
Notifications

Englishहिंदीमराठी


      Forgot password?
Use app×