Advertisements
Advertisements
Question
The following frequency distribution shows the profit (in ₹) of shops in a particular area of city:
| Profit per shop (in ‘000) | No. of shops |
| 0 – 10 | 12 |
| 10 – 20 | 18 |
| 20 – 30 | 27 |
| 30 – 40 | 20 |
| 40 – 50 | 17 |
| 50 – 60 | 6 |
Find graphically the number of shops having profile less than 35,000 rupees.
Solution
The less than cumulative frequency table is
| Profit per shop (in ‘000) |
No. of shops (f) |
Less than cumulative Frequency (c.f.) |
| 0 – 10 | 12 | 12 |
| 10 – 20 | 18 | 30 |
| 20 – 30 | 27 | 57 |
| 30 – 40 | 20 | 77 |
| 40 – 50 | 17 | 94 |
| 50 – 60 | 6 | 100 |
| Total | 100 |
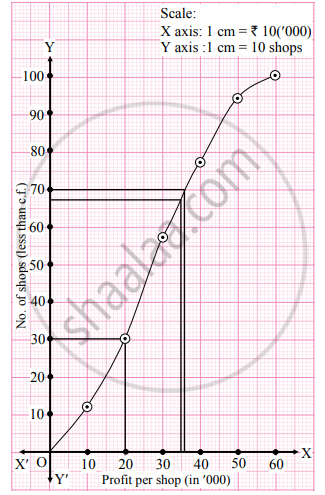
Points to be plotted are (10, 12), (20, 30), (30, 57), (40, 77), (50, 94), (60, 100).
Limits of middle 40% shops lie between ₹ 20,000 to ₹ 36,000
To find the number of shops having a profit less than ₹ 35,000, we take the value 35 on the X-axis. From this point, we draw a line parallel to Y-axis, and from the point where it intersects the less than ogive we draw a perpendicular on Y-axis. It intersects the Y-axis at approximately 67.
∴ No. of shops having a profit less than ₹ 35,000 is 67.
APPEARS IN
RELATED QUESTIONS
The following table gives frequency distribution of marks of 100 students in an examination.
| Marks | 15 –20 | 20 – 25 | 25 – 30 | 30 –35 | 35 – 40 | 40 – 45 | 45 – 50 |
| No. of students | 9 | 12 | 23 | 31 | 10 | 8 | 7 |
Determine D6, Q1, and P85 graphically.
The following table gives the distribution of daily wages of 500 families in a certain city.
| Daily wages | No. of families |
| Below 100 | 50 |
| 100 – 200 | 150 |
| 200 – 300 | 180 |
| 300 – 400 | 50 |
| 400 – 500 | 40 |
| 500 – 600 | 20 |
| 600 above | 10 |
Draw a ‘less than’ ogive for the above data. Determine the median income and obtain the limits of income of central 50% of the families.
The following frequency distribution shows the profit (in ₹) of shops in a particular area of city:
| Profit per shop (in ‘000) | No. of shops |
| 0 – 10 | 12 |
| 10 – 20 | 18 |
| 20 – 30 | 27 |
| 30 – 40 | 20 |
| 40 – 50 | 17 |
| 50 – 60 | 6 |
Find graphically The limits of middle 40% shops.
The following is the frequency distribution of overtime (per week) performed by various workers from a certain company.
Determine the values of D2, Q2, and P61 graphically.
| Overtime (in hours) |
Below 8 | 8 – 12 | 12 – 16 | 16 – 20 | 20 – 24 | 24 and above |
| No. of workers | 4 | 8 | 16 | 18 | 20 | 14 |
Draw ogive for the following data and hence find the values of D1, Q1, P40.
| Marks less than | 10 | 20 | 30 | 40 | 50 | 60 | 70 | 80 | 90 |
| No. of students | 4 | 6 | 24 | 46 | 67 | 86 | 96 | 99 | 100 |
The following table gives the distribution of females in an Indian village. Determine the median age of graphically.
| Age group | No. of females (in ‘000) |
| 0 – 10 | 175 |
| 10 – 20 | 100 |
| 20 – 30 | 68 |
| 30 – 40 | 48 |
| 40 – 50 | 25 |
| 50 – 60 | 50 |
| 60 – 70 | 23 |
| 70 – 80 | 8 |
| 80 – 90 | 2 |
| 90 – 100 | 1 |
Draw ogive for the Following distribution and hence find graphically the limits of weight of middle 50% fishes.
| Weight of fishes (in gms) | 800 – 890 | 900 – 990 | 1000 – 1090 | 1100 – 1190 | 1200 – 1290 | 1300 –1390 | 1400 – 1490 |
| No. of fishes | 8 | 16 | 20 | 25 | 40 | 6 | 5 |
Find graphically the values of D3 and P65 for the data given below:
| I.Q of students | 60 – 69 | 70 – 79 | 80 – 89 | 90 – 99 | 100 – 109 | 110 – 119 | 120 – 129 |
| No. of students | 20 | 40 | 50 | 50 | 20 | 10 | 10 |
Determine graphically the value of median, D3, and P35 for the data given below:
| Class | 10 – 15 | 15 – 20 | 20 – 25 | 25 – 30 | 30 – 35 | 35 – 40 | 40 – 45 |
| Frequency | 8 | 14 | 8 | 25 | 15 | 14 | 6 |
The I.Q. test of 500 students of a college is as follows:
| I.Q. | 20 – 30 | 30 – 40 | 40 – 50 | 50 – 60 | 60 – 70 | 70 – 80 | 80 – 90 | 90 – 100 |
| Number of students | 41 | 52 | 64 | 180 | 67 | 45 | 40 | 11 |
Find graphically the number of students whose I.Q. is more than 55 graphically.
Draw an ogive for the following distribution. Determine the median graphically and verify your result by mathematical formula.
| Height (in cms.) | No. of students |
| 145 − 150 | 2 |
| 150 − 155 | 5 |
| 155 − 160 | 9 |
| 160 − 165 | 15 |
| 165 − 170 | 16 |
| 170 − 175 | 7 |
| 175 − 180 | 5 |
| 180 − 185 | 1 |
Draw ogive of both the types for the following frequency distribution and hence find median.
| Marks | 0 – 10 | 10 – 20 | 20 – 30 | 30 – 40 | 40 – 50 | 50 – 60 | 60 – 70 | 70 – 80 | 80 – 90 | 90 – 100 |
| No. of students | 5 | 5 | 8 | 12 | 16 | 15 | 10 | 8 | 5 | 2 |
