Advertisements
Advertisements
Question
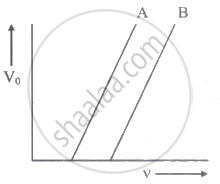
The following graph shows the stopping potential V0 versus frequency v for photoelectric emission from two metals A and B. The slope of each of the lines gives ______

Options
the charge of an electron.
Planck's constant.
the product of the charge of electron and Planck's constant.
the ratio of Planck's constant and the charge of the electron.
MCQ
Fill in the Blanks
Solution
The following graph shows the stopping potential V0 versus frequency v for photoelectric emission from two metals A and B. The slope of each of the lines gives the ratio of Planck's constant and the charge of the electron.
Explanation:
The slope of V0 versus v graph is `"h"/"e"` because
eV0 = hv - hv0
∴ V0 = `"h"/"e""v" - "h"/"e""v"_0`.
shaalaa.com
The Photoelectric Effect
Is there an error in this question or solution?
