Advertisements
Advertisements
Question
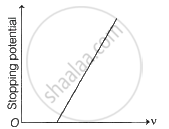
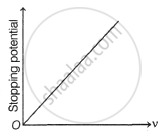
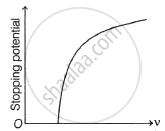
The following graphs show the variation of stopping potential corresponding to the frequency of incident radiation (ν) for a given metal. The correct variation is shown in graph [ν0 = threshold frequency].
|
(A) |
(B) |
|
(C) |
(D) |
Options
(D)
(A)
(B)
(C)
MCQ
Solution
(A)
Explanation:
From Einstein's photoelectric equation,
Kmax = hν - Φ0
⇒ eV0 = hν - hν0
or V0 = `h/e(ν - ν_0)`
As a result, Figure A accurately depicts a graph illustrating the variable stopping potential and frequency.
shaalaa.com
The Photoelectric Effect
Is there an error in this question or solution?


