Advertisements
Advertisements
Question
The following table gives the number of small-scale units registered with the Directorate of Industries between 1985 and 1991. Show the growth on a trend line by the free hand method.
| Year | No. of units (in '000) |
| 195 | 10 |
| 986 | 22 |
| 1987 | 36 |
| 198 | 62 |
| 1989 | 55 |
| 1990 | 0 |
| 1991 | 34 |
| 1992 | 50 |
Solution
We follow the procedure as given below:
(a) Plot the data on a graph
(b) Join all the points by a free hand smooth curve
(c) A line is drawn which passes through the maximum number of plotted points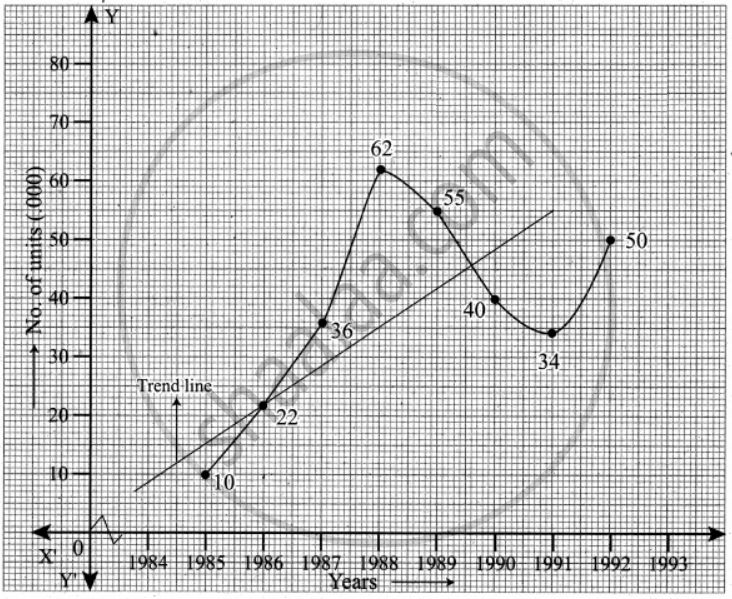
APPEARS IN
RELATED QUESTIONS
Explain cyclic variations
Discuss about irregular variation
The sales of a commodity in tones varied from January 2010 to December 2010 as follows:
| In Year 2010 | Sales (in tones) |
| Jan | 280 |
| Feb | 240 |
| Mar | 270 |
| Apr | 300 |
| May | 280 |
| Jun | 290 |
| Jul | 210 |
| Aug | 200 |
| Sep | 230 |
| Oct | 200 |
| Nov | 230 |
| Dec | 210 |
Fit a trend line by the method of semi-average
Calculate the seasonal indices from the following data using the average method:
| Year | I Quarter | II Quarter | III Quarter | IV Quarter |
| 2008 | 72 | 68 | 62 | 76 |
| 2009 | 78 | 74 | 78 | 72 |
| 2010 | 74 | 70 | 72 | 76 |
| 2011 | 76 | 74 | 74 | 72 |
| 2012 | 72 | 72 | 76 | 68 |
Using three yearly moving averages, Determine the trend values from the following data.
| Year | Profit | Year | Profit |
| 2001 | 142 | 2007 | 241 |
| 2002 | 148 | 2008 | 263 |
| 2003 | 154 | 2009 | 280 |
| 2004 | 146 | 2010 | 302 |
| 2005 | 157 | 2011 | 326 |
| 2006 | 202 | 2012 | 353 |
Fit a straight line trend by the method of least squares to the following data
| Year | 1980 | 1981 | 1982 | 1983 | 1984 | 1985 | 1986 | 1987 |
| Sales | 50.3 | 52.7 | 49.3 | 57.3 | 56.8 | 60.7 | 62.1 | 58.7 |
The sum of the series `log_4 2 - log_8 2 + log_16 2 + ...............` to `oo` is
Let An be the sum of the first n terms of the geometric series `704 + 704/2 + 704/4 + 704/8 + ...` and Bn be the sum of the first n terms of the geometric series `1984 - 1984/2 + 1984/4 + 1984/8 + ...` If An = Bn, then the value ofn is (where n ∈ N).
Sum of the first n terms of the series `1/2 + 3/4 + 7/8 + 15/16 +`......... is equal to:
The sum of the series 3.6 + 4.7 + 5.8 + ....... upto (n – 2) terms
