Advertisements
Advertisements
Question
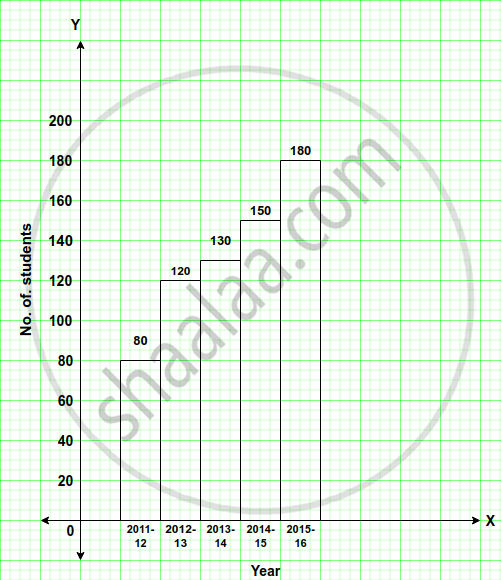
The following table gives the number of students in class VI in a school during the academic years 2011-2012 to 2015-2016.
| Academic years | 2011 - 12 | 2012 - 13 | 2013- 2014 | 2014- 2015 | 2015 - 16 |
| No. of. students | 80 | 120 | 130 | 150 | 180 |
Represent the above data by a bar graph.
Graph
Solution
shaalaa.com
Is there an error in this question or solution?
