Advertisements
Advertisements
Question
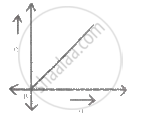
The graph shows the variation of fringe width (β) versus distance of the screen from the plane of the slits (D) in Young's double-slit experiment Keeping other parameters the same. The wavelength of light used can be calculated as d = distance between the slits ______
Options
the slope of graph × d
slope of graph/d
the slope of graph × d2
d/slope of graph
MCQ
Fill in the Blanks
Solution
The graph shows the variation of fringe width (β) versus distance of the screen from the plane of the slits (D) in Young's double-slit experiment Keeping other parameters the same. The wavelength of light used can be calculated as d = distance between the slits the slope of graph × d.
Explanation:
`beta = (lambdaD)/d`
slope = `beta/D = lambda/d`
∴ λ = slope × d
shaalaa.com
Is there an error in this question or solution?
