Advertisements
Advertisements
Question
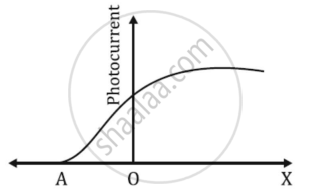
The graph shows the variation of photocurrent for a photosensitive metal
- What does X and A on the horizontal axis represent?
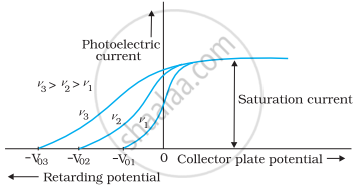
- Draw this graph for three different values of frequencies of incident radiation ʋ1, ʋ2 and ʋ3 (ʋ3 > ʋ2 > ʋ1) for the same intensity.
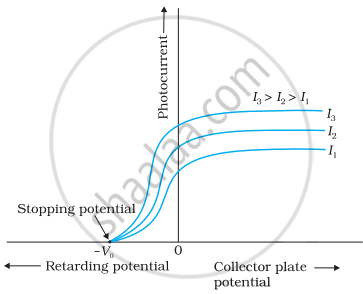
- Draw this graph for three different values of intensities of incident radiation I1, I2 and I3 (I3 > I2 > I1) having the same frequency.
Solution
a. A - cut off or stopping potential
X - anode potential
b. 
Variation of photoelectric current with collector plate potential for different frequencies of incident radiation.
c.
Variation of photocurrent with collector plate potential for different intensity of incident radiation.
APPEARS IN
RELATED QUESTIONS
If an electron has a wavelength, does it also have a colour?
Two photons of
The equation E = pc is valid
The work function of a metal is hv0. Light of frequency v falls on this metal. Photoelectric effect will take place only if
If the frequency of light in a photoelectric experiment is doubled, the stopping potential will ______.
A point source causes photoelectric effect from a small metal plate. Which of the following curves may represent the saturation photocurrent as a function of the distance between the source and the metal?

Calculate the momentum of a photon of light of wavelength 500 nm.
(Use h = 6.63 × 10⁻³⁴J-s = 4.14 × 10⁻¹⁵ eV-s, c = 3 × 10⁸ m/s and me = 9.1 × 10⁻³¹kg)
Consider a metal exposed to light of wavelength 600 nm. The maximum energy of the electron doubles when light of wavelength 400 nm is used. Find the work function in eV.
Two monochromatic beams A and B of equal intensity I, hit a screen. The number of photons hitting the screen by beam A is twice that by beam B. Then what inference can you make about their frequencies?
Consider a thin target (10–2 cm square, 10–3 m thickness) of sodium, which produces a photocurrent of 100 µA when a light of intensity 100W/m2 (λ = 660 nm) falls on it. Find the probability that a photoelectron is produced when a photons strikes a sodium atom. [Take density of Na = 0.97 kg/m3].
