Advertisements
Advertisements
Question
The number of lily plants in a pond was found to be 50. After one year, the number. increased to 65. Calculate the natality of lily plants.
Solution
Given that the initial number of lily plants was 50 and increased to 65 after one year, the population increase is 65 − 50 = 15 plants. The time period is 1 year. So, the calculation is:
`"Natality Rate" = "Increase in Population"/"Original Population" × "Time Period"`
`"Natality Rate" = 15/50 × 1`
`"Natality Rate" = 15/50`
`"Natality Rate" = 0.3`
This means the pond's lily plants have a natality rate of 0.3 per plant per year.
APPEARS IN
RELATED QUESTIONS
(a) Name the two growth models that represent population growth and draw the respective growth curves they represent.
(b) State the basics for the difference in the shape of these curves
(c) Which one of the curves represents the human population growth at present? Do you think such a curve is sustainable? Give reason in support of your answer.
Study the graph given below and answer the questions that follow :
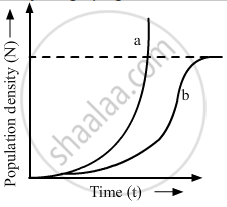
(i) Write the status of food and space in the curves (a) and (b).
(ii) In the absence of predators, which one of the two curves would appropriately depict the prey population?
(iii) Time has been shown on X-axis and there is a parallel dotted line above it. Give the significance of this dotted line
List the attributes that populations but not individuals possess.
If a population growing exponentially double in size in 3 years, what is the intrinsic rate of increase (r) of the population?
Age distribution in a population can influence
The density of a population in a habitat per unit area is measured in different units. Write the unit of measurement against the following:
Deer
The following diagrams are the age pyramids of different populations. Comment on the status of these populations.

What would be the best method to measure the total population density of a dense bacterial culture in a petridish and why?
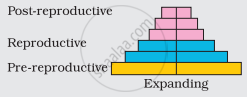
Identify the type of pyramid given above. Write the identifying feature on the basis of which you identified it.
Important attributes belonging to a population but not to an individual are:
- Birth rate and death rate
- Male and female
- Birth and death
- Sex-ratio
Select the correct option from the given options:
