Advertisements
Advertisements
Question
The total area of the histogram is _________ to the total frequency of the given data
Advertisements
Solution
The total area of the histogram is proportional to the total frequency of the given data
APPEARS IN
RELATED QUESTIONS
Draw histogram for the following frequency distributions:
| Class Interval | 30 – 39 | 40 – 49 | 50 – 59 | 60 – 69 | 70 – 79 |
| Frequency | 24 | 16 | 09 | 15 | 20 |
| Result (Percentage) | 30 - 40 | 40 - 50 | 50 - 60 | 60 -70 | 70 - 80 | 80 - 90 | 90 - 100 |
| No. of students | 7 | 33 | 45 | 65 | 47 | 18 | 5 |
Draw the Histogram and hence, the frequency polygon for the following frequency distribution:
| House Rent (In ₹ per month) | 400-600 | 600-800 | 800-1000 | 1000-1200 |
| Number of families | 200 | 240 | 300 | 50 |
Draw a histogram and frequency polygon to represent the following data (on the same scale) which shows the monthly cost of living index of a city in a period of 2 years:
| Cost of living Index | Number of months |
| 440 - 460 | 2 |
| 460 - 480 | 4 |
| 480 - 500 | 3 |
| 500 - 520 | 5 |
| 520 - 540 | 3 |
| 540 - 560 | 2 |
| 560 - 580 | 1 |
| 580 - 600 | 4 |
| Total | 24 |
Draw a histogram to represent the following data:
| Pocket money in ₹ | No. of Students |
| 150 - 200 | 10 |
| 200 - 250 | 5 |
| 250 - 300 | 7 |
| 300 - 350 | 4 |
| 350 - 400 | 3 |
Identify the following data can be represented in a histogram?
Production of cycles in different years
Identify the following data can be represented in a histogram?
The number of students in each class of a school
Histogram shows the number of people owning the different number of books. Answer the question based on it.

The total number of people surveyed is ______.
Histogram shows the number of people owning the different number of books. Answer the question based on it.
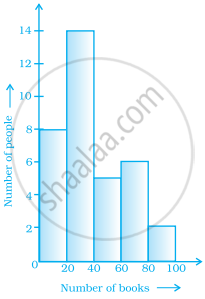
The number of people owning books more than 60 is ______.
Prepare a histogram from the frequency distribution table obtained in question 93.
