Advertisements
Advertisements
Question
The total number of students of a school in different years is shown in the following table
| Years | Number of students |
| 1996 | 400 |
| 1998 | 535 |
| 2000 | 472 |
| 2002 | 600 |
| 2004 | 623 |
Prepare a pictograph of students using one symbol  to represent 100 students and answer the following questions:
How many symbols represent the total number of students in the year 2002?
Solution
 |
|
| 1996 |  |
| 1998 |  |
| 2000 |  |
| 2002 |  |
| 2004 |  |
The total number of students in the year 2002 represents 6 symbols.
APPEARS IN
RELATED QUESTIONS
Total number of animals in five villages are as follows:
Village A: 80
Villages B: 120
Village C: 90
Village D: 40
Village E: 60
Prepare a pictograph of these animals using one symbol ⊗ to represent 10 animals and answer the following questions:
(a) How many symbols represent animals of village E?
(b) Which village has the maximum number of animals?
(c) Which village has more animals: village A or village C?
If 200 is represented by  then 600 is represented by ____________
Draw a pictograph for the given data.
| Month | June | July | August | September |
| Number of Computers sold | 300 | 450 | 600 | 550 |
(Choose your own suitable scale)
The following table shows the number of tourists who visited the places in the month of May. Draw a pictograph
| Place | Mahabalipuram | Vedanthangal | Hogenakkal | Ooty |
| Number of Tourists | 20,000 | 15,000 | 40,000 | 35,000 |
(Choose your own suitable scale)
The following Pictograph shows the number of students playing different games in a school.
| Game | Number of Students |
| Kho-Kho |  |
| Kabaddi | 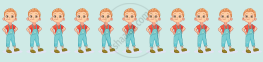 |
| Basketball |  |
| Volleyball |  |
| Hockey |  |
 Represents 10 students
Answer the following questions.
(i) Which is the most popular game among the students?
(ii) Find the number of students playing Kabaddi.
(iii) Which two games are played by equal number of students?
(iv) What is the difference between the number of students playing Kho-Kho and Hockey?
(v) Which is the least popular game among the students?
There are 1000 students in a school. Data regarding the mode of transport of the students is given below. Draw a pictograph to represent the data.
| Mode of Travel | On Foot | Bicycle | Scooter | Bus | Car |
| Number of Students | 350 | 300 | 150 | 100 | 100 |
26 students were interviewed to find out what they want to become in future. Their responses are given in the following table.
| Profession | Tally marks |
| Teacher | |||| || |
| Pilot | ||| |
| Bank Manager | |||| |
| Doctor | ||| |
| Engineer | |||| |
| Other Professions | ||| |
Represent this data using Pictograph.
Yasmin of class VI was given a task to count the number of books which are biographies, in her school library. The information collected by her is represented as follows.
| Biographies | Number of books |
| Mathematicians |  |
| Scientists |  |
| Novelists |  |
| Sportspersons |  |
| Politicians |  |
Keys: 
Observe the pictograph and answer the following questions.
(i) Which title has the maximum number of biographies?
(ii) Which title has the minimum number of biographies?
(iii) Which title has exactly half the number of biographies as Novelists?
(iv) How many biographies are there on the title of Sportspersons?
(v) What is the total number of biographies in the library?
The total number of students of a school in different years is shown in the following table.
| Years | Number of students |
| 1996 | 400 |
| 1998 | 535 |
| 2000 | 472 |
| 2002 | 600 |
| 2004 | 623 |
Prepare a pictograph of students using one symbol to represent 100 students and answer the following questions:
How many symbols represent the total number of students for the year 1998?
Prepare another pictograph of students using any other symbol each representing 50 students. Which pictograph do you find more informative?
