Advertisements
Advertisements
Question
The total number of students present in class VI B, for the six days in a week were as given below. Draw a suitable bar graph.
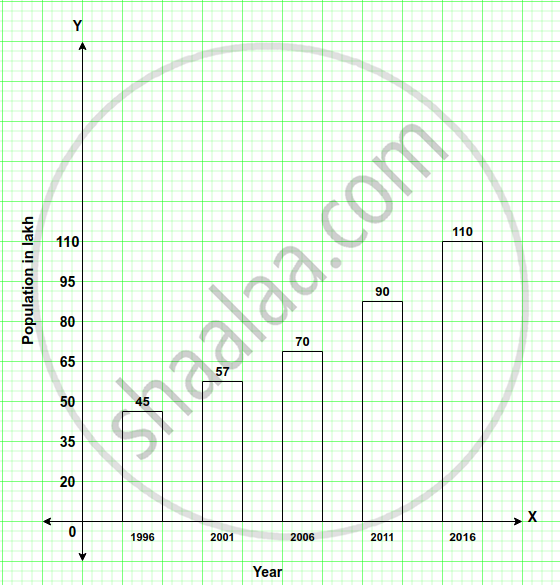
| Year | 1996 | 2001 | 2006 | 2011 | 2016 |
| Population in Lakh | 45 | 57 | 70 | 90 | 110 |
Represent the above information with the help of a suitable bar graph.
Graph
Solution

shaalaa.com
Is there an error in this question or solution?
