Advertisements
Advertisements
Question
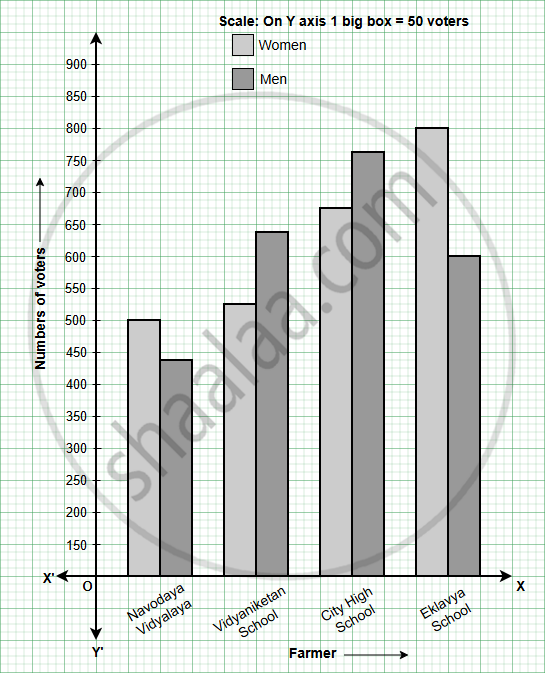
There are four polling booths for a certain election. The numbers of men and women who cast their vote at each booth is given in the table below. Draw a joint bar graph for this data.
| Polling Booths | Navodaya Vidyalaya |
Vidyaniketan School |
City High School | Eklavya School |
| Women | 500 | 520 | 680 | 800 |
| Men | 440 | 640 | 760 | 600 |
Graph
Solution
The joint bar graph for the given data is:

shaalaa.com
Is there an error in this question or solution?
