Advertisements
Advertisements
Question
Study the following table, figure, passage and answer the question below it:
| Units | Total Utility | Marginal Utility |
| 1. | 40 | ______ |
| 2. | 60 | 20 |
| 3. | 70 | 10 |
| 4. | ______ | 0 |
| 5. | 60 | -10 |
- Complete the table ______ (1m )
- When Total utility falls Marginal utility is_______ (1m)
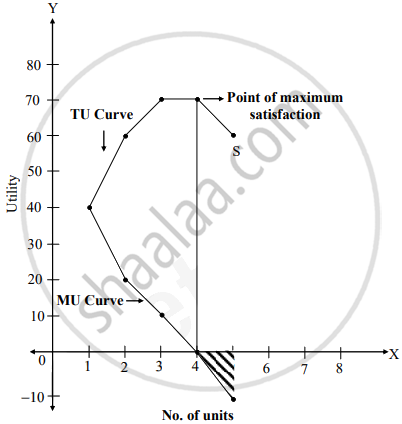
- Draw total utility and marginal utility curve______ (2m)
Solution
A. Complete the table
| Units | Total Utility | Marginal Utility |
| 1. | 40 | 40 |
| 2. | 60 | 20 |
| 3. | 70 | 10 |
| 4. | 70 | 0 |
| 5. | 60 | -10 |
B. When total utility falls, marginal utility is negative.
C. Draw total utility and marginal utility curve.

RELATED QUESTIONS
Aggregate of utility derived by the consumer from all units of a commodity consumed −
In relationship between Total Utility & Marginal Utility, MU (Marginal Utility) of a commodity becomes negative when TU (Total Utility) of a commodity is ______.
Identify & explain the concept from the given illustration.
Kavita consumed an additional unit of bread to satisfy her hunger.
Distinguish Between:
Total Utility and Marginal Utility
Explain the relationship between total utility and marginal utility
State with reason whether you agree or disagree with the following statement
When total utility is maximum, marginal utility is zero.
Give economic terms:
Additional utility derived by a consumer from an additional unit consumed.
Assertion and reasoning question:
- Assertion (A): Marginal utility (MU) goes on diminishing.
- Reasoning (R): Total utility (TU) increases at a diminishing rate.
