Advertisements
Advertisements
Question
Use graph paper for this question.
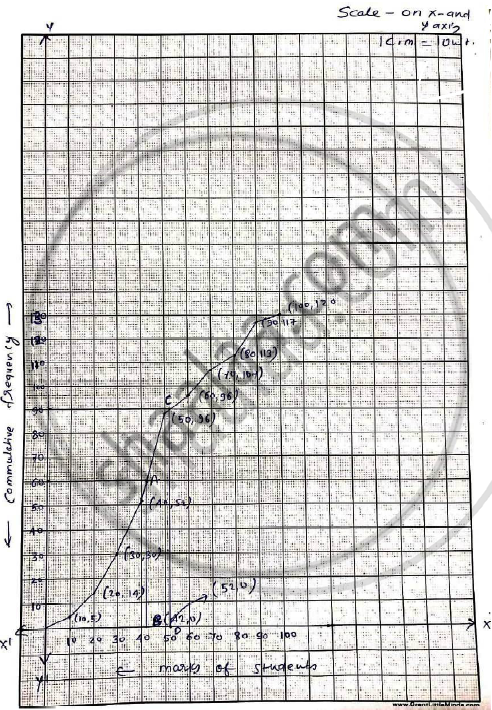
The marks obtained by 120 students in an English test are given below :
| Marks | 0 - 10 | 10 - 20 | 20 - 30 | 30 - 40 | 40 - 50 | 50 - 60 | 60 - 70 | 70 - 80 | 80 - 90 | 90 -100 |
| No.of students | 5 | 9 | 16 |
22 |
26 | 18 |
11 |
6 | 4 | 3 |
Draw the ogive and hence, estimate:
(i) the median marks.
(ii) the number of students who did not pass the test if the pass percentage was 50.
(iii) the upper quartile marks.
Solution

| C.I | Marks less than |
No.of students |
Cumulative frequency |
| 0-10 | 10 | 5 | 5 |
| 10-20 | 20 | 9 | 14 |
| 20-30 | 30 | 16 | 30 |
| 30-40 | 40 | 22 | 52 |
| 40-50 | 50 | 26 | 78 |
| 50-60 | 60 | 18 | 96 |
| 60-70 | 70 | 11 | 107 |
| 70-80 | 80 | 6 | 113 |
| 80-90 | 90 | 4 | 117 |
| 90-100 | 100 | 3 | 120 |
i. No.of students =120
∴ Median = 60th term through marks of 60 draw a line parallel to x - axis which meets the curve at A. From A draw perpendicular to x-axis, which meets it at A . From A draw a perpendicular to x-axis which
meets it at B.
ii. The upper quartile marks `(Q_3 ) = 3/4 n^(th)` term
`= 3^(th)/4 xx 120= 90^(th) ` term
draw a line parallel to x-axis which meets the 1 curve at C. From C draw perpendicular to x-axis which meets it at D.
APPEARS IN
RELATED QUESTIONS
The monthly income of a group of 320 employees in a company is given below:
| Monthly Income | No. of Employees |
| 6000-7000 | 20 |
| 7000-8000 | 45 |
| 8000-9000 | 65 |
| 9000-10000 | 95 |
| 10000-11000 | 60 |
| 11000-12000 | 30 |
| 12000-13000 | 5 |
Draw an ogive the given distribution on a graph sheet taking 2 cm = Rs. 1000 on one axis and 2 cm = 50 employees on the other axis. From the graph determine:
(1) the median wage
(2) the number of employees whose income is below Rs. 8500.
(3) if the salary of a senior employee is above Rs. 11,500, find the number of senior employees in the company.
(4) the upper quartile.
Use graph paper for this question, take 2 cm = 10 marks along one axis and 2 cm = 10 students along the other axis.
The following table shows the distribution of marks in a 50 marks test in Mathematics:
| Marks | 0 - 10 | 10 - 20 | 20 - 30 | 30 - 40 | 40 - 50 |
| No. of. Students | 6 | 10 | 13 | 7 | 4 |
Draw the ogive for the above distribution and hence estimate the median marks.
Use graph paper to Solution this question.
During a medical checkup of 60 students in a school, weights were recorded as follows:
| Weight (in kg) | Number of Students (f) |
| 28 – 30 | 2 |
| 30 – 32 | 4 |
| 32 – 34 | 10 |
| 34 – 36 | 13 |
| 36 – 38 | 15 |
| 38 – 40 | 9 |
| 40 – 42 | 5 |
| 42 – 44 | 2 |
Taking 2 cm = 2 kg along one axis and 2 cm = 10 students along the other axis draw an ogive. Use your graph to find the:
- median
- upper Quartile
- number of students whose weights is above 37 kg
A life insurance agent found the following data for distribution of ages of 100 policy holders.
| Age in years | Policy Holders (frequency) |
Cumulative frequency |
| 20 – 25 | 2 | 2 |
| 25 – 30 | 4 | 6 |
| 30 – 35 | 12 | 18 |
| 35 – 40 | 20 | 38 |
| 40 – 45 | 28 | 66 |
| 45 – 50 | 22 | 88 |
| 50 – 55 | 8 | 96 |
| 55 – 60 | 4 | 100 |
On a graph sheet draw an ogive using the given data. Take 2 cm = 5 years along one axis and 2 cm = 10 policy holders along the other axis.
Use your graph to find:
- The median age.
- Number of policy holders whose age is above 52 years.
