Advertisements
Advertisements
Question
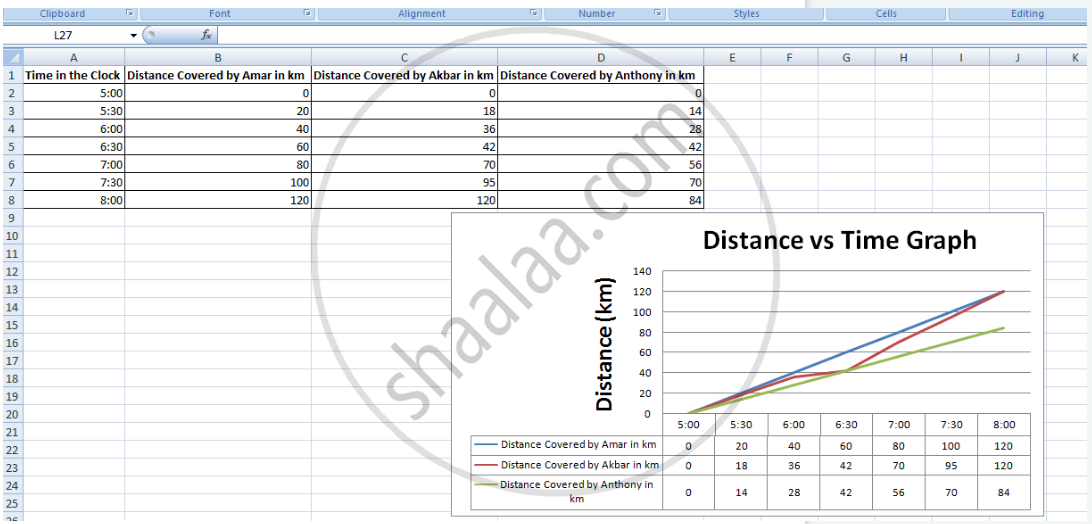
Using a spreadsheet, draw graphs between distance and time, using the information about the movements of Amar, Akbar and Anthony given in the table below in the lesson on the Laws of Motion. What precautions will you take while drawing the graph?
| Time in the clock | Distance covered by Amar in km. |
Distance covered by Akbar in km. |
Distance covered by Anthony in km. |
| 5.00 | 0 | 0 | 0 |
| 5.30 | 20 | 18 | 14 |
| 6.00 | 40 | 36 | 28 |
| 6.30 | 60 | 42 | 42 |
| 7.00 | 80 | 70 | 56 |
| 7.30 | 100 | 95 | 70 |
| 8.00 | 120 | 120 | 84 |
Graph
Solution
Precautions to be followed while drawing the graph:
- Keep the data in tabular form.
- Data should be entered sequentially.
- Avoid using unnecessary space and special characters.
shaalaa.com
Is there an error in this question or solution?
