Advertisements
Advertisements
Question
What is the source of winter rainfall in Punjab?
Solution
Western disturbances originating in the Mediterranean region/Temperate cyclones.
APPEARS IN
RELATED QUESTIONS
Name a state that is the first to experience the onset of the monsoon.
Give a reason for each of the following:
Thar is a desert
Give an account of weather conditions and characteristics of the cold season.
| Stations | Latitude | Altitude (Metres) | Jan. | Feb. | Mar. | Apr. | May. | Jun. | July. | Aug. | Sep. | Oct. | Nov. | Dec. | Annual Rainfall |
|
Temperature (°C) |
20.5 |
22.7 |
25.2 |
27.1 |
26.7 |
24.2 |
23.0 |
23.0 |
23.1 |
22.9 |
18.9 |
20.2 |
|||
| Bengaluru | 12°58'N | 909 |
|
|
|
||||||||||
| Rainfall (cm) | 0.7 | 0.9 | 1.1 | 4.5 | 10.7 | 7.1 | 11.1 | 13.7 | 16.4 |
15.3 |
6.1 |
1.3 |
88.9 | ||
|
Temperature (°C) |
24.4 |
24.4 |
26.7 |
28.3 |
30.0 |
28.9 |
27.2 |
27.2 |
27.2 |
27.8 |
27.2 |
25.0 |
|||
|
Mumbai |
19° N | 11 |
|
|
|
|
|
|
|
|
|
|
|
|
|
|
Rainfall (cm) |
0.2 |
0.2 |
– |
– |
1.8 |
50.6 |
61.0 |
36.9 |
26.9 |
4.8 |
1.0 |
– |
183.4 | ||
|
Temperature (°C) |
19.6 |
22.0 |
27.1 |
30.1 |
30.4 |
29.9 |
28.9 |
28.7 |
28.9 |
27.6 |
23.4 |
19.7 |
|||
|
Kolkata |
22°34'N | 6 |
|
|
|
|
|
|
|
|
|
|
|
|
|
|
Rainfall (cm) |
1.2 |
2.8 |
3.4 |
5.1 |
13.4 |
29.0 |
33.1 |
33.4 |
25.3 |
12.7 |
2.7 |
0.4 |
162.5 | ||
|
Temperature (°C) |
14.4 |
16.7 |
23.3 |
30.0 |
33.3 |
33.3 |
30.0 |
29.4 |
28.9 |
25.6 |
19.4 |
15.6 |
|||
|
Delhi |
29° N | 219 |
|
|
|
|
|
|
|
|
|
|
|
|
|
|
Rainfall (cm) |
2.5 |
1.5 |
1.3 |
1.0 |
1.8 |
7.4 |
19.3 |
17.8 |
11.9 |
1.3 |
0.2 |
1.0 |
67.0 | ||
|
Temperature (°C) |
16.8 |
19.2 |
26.6 |
29.8 |
33.3 |
33.9 |
31.3 |
29.0 |
20.1 |
27.0 |
20.1 |
14.9 |
|||
|
Jodhpur |
26°18'N | 224 |
|
|
|
|
|
|
|
|
|
|
|
|
|
|
Rainfall (cm) |
0.5 |
0.6 |
0.3 |
0.3 |
1.0 |
3.1 |
10.8 |
13.1 |
5.7 |
5.7 |
0.2 |
0.2 |
36.6 | ||
|
Temperature (°C) |
24.5 |
25.7 |
27.7 |
30.4 |
33.0 |
32..5 |
31.0 |
30.2 |
29.8 |
28.0 |
25.9 |
24.9 |
|||
|
Chennai |
13°4'N | 7 |
|
|
|
|
|
|
|
|
|
|
|
|
|
|
Rainfall (cm) |
4.6 |
1.3 |
1.3 |
1.8 |
3.8 |
22.2 |
8.7 |
11.3 |
11.9 |
30.6 |
35.0 |
0.2 |
128.6 | ||
|
Temperature (°C) |
21.5 |
23.9 |
28.3 |
32.7 |
35.5 |
32.0 |
27.7 |
27.3 |
27.9 |
26.7 |
23.1 |
20.7 |
|||
|
Nagpur |
21°9'N | 312 |
|
|
|
|
|
|
|
|
|
|
|
|
|
|
Rainfall (cm) |
1.1 |
2.3 |
1.7 |
1.6 |
2.1 |
22.2 |
37.6 |
28.6 |
18.5 |
5.5 |
2.0 |
13.9 |
124.2 | ||
|
Temperature (°C) |
9.8 |
11.3 |
15.9 |
18.5 |
19.2 |
20.5 |
21.1 |
20.9 |
20.9 |
17.2 |
13.3 |
10.4 |
|||
|
Shillong |
24°34'N | 1461 |
|
|
|
|
|
|
|
|
|
|
|
|
|
|
Rainfall (cm) |
1.4 |
2.9 |
5.6 |
14.6 |
29.5 |
47.6 |
35.9 |
34.3 |
30.2 |
18.8 |
3.8 |
1.0 |
225.3 | ||
|
Temperature (°C) |
26.7 |
27.3 |
28.3 |
28.7 |
28.6 |
26.6 |
26.2 |
26.2 |
26.5 |
26.7 |
26.6 |
26.5 |
|||
|
Thiruvananthapuram |
8°29'N | 61 |
|
|
|
|
|
|
|
|
|
|
|
|
|
|
Rainfall (cm) |
2.3 |
2.1 |
3.7 |
10.6 |
20.8 |
35.6 |
22.3 |
14.6 |
13.8 |
27.3 |
20.6 |
7.5 |
181.2 | ||
|
Temperature (°C) |
−8.5 |
−7.2 |
−0.6 |
6.1 |
10.0 |
14.4 |
17.2 |
16.1 |
12.2 |
6.1 |
0.0 |
−5.6 |
|||
|
Leh |
34°N | 3506 |
|
|
|
|
|
|
|
|
|
|
|
|
|
|
Rainfall (cm) |
1.0 |
0.8 |
0.8 |
0.5 |
0.5 |
0.5 |
1.3 |
1.3 |
0.8 |
0.5 |
– |
0.5 |
8.5 |
In above Table the average mean monthly temperatures and amounts of rainfall of ten representative stations have been given. It is for you to study on your own and convert them into ‘temperature and rainfall’ graphs. A glance at these visual representations will help you to grasp instantly the similarities and differences between them. One such graph (Figure 1) is already prepared for you. See if you can arrive at some broad generalisations about our diverse climatic conditions. 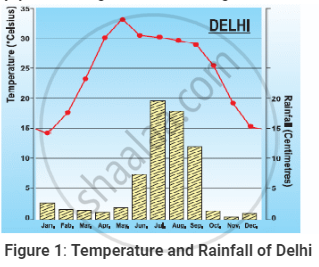
What are ‘Western Disturbances’?
Mumbai receives rainfall in the summer season while Chennai receives rainfall from October to December. Why?
Given below is the climatic data of a station. Study the table and answer the questions that follow:
| Month | Jan. | Feb. | Mar. | Apr. | May | June | July | Aug. | Sep. | Oct. | Nov. | Dec. |
| Temperature °C | 24.5 | 25.7 | 27.7 | 20-4 | 30.0 | 32.5 | 31.0 | 30.2 | 29.8 | 28.0 | 25.9 | 24.7 |
| Rainfall cm | 4.6 | 1.3 | 1.3 | 1.8 | 3.8 | 4.5 | 8.7 | 11.3 | 11.9 | 30.6 | 35.0 | 13.9 |
(i) Calculate the annual rainfall experienced by the station.
(ii) What is the annual range of temperature?
(iii) Name the wettest month.
Study the climatic data given below and answer the questions that follow:
| Month | Jan. | Feb. | Mar. | Apr. | May | Jun. | Jul. | Aug. | Sep. | Oct. | Nov. | Dec. |
| °C | 25.0 | 25.5 | 26.3 | 27.1 | 30.0 | 36.2 | 36.0 | 35.9 | 30.3 | 28.4 | 27.0 | 24.6 |
| cm | 24.5 | 23.1 | 15.0 | 2.4 | 0.1 | 11.0 | 9.3 | 7.2 | 4.0 | 9.4 | 14.5 | 20.4 |
(i) Calculate the annual temperature range.
(ii) What is the total annual rainfall?
(iii) Presuming that the station is located in India, give a reason for its location being on the east coast or the west coast of India.
Name two types of cyclonic systems that affect India and two areas that receive rainfall from these systems.
The highest rainfall region in India is located in this state.
