Advertisements
Advertisements
Question
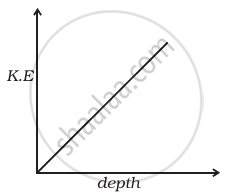
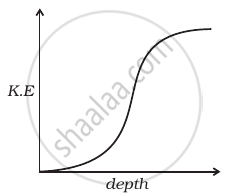
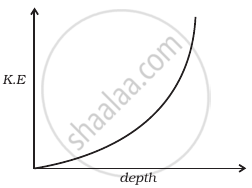
Which of the diagrams in figure correctly shows the change in kinetic energy of an iron sphere falling freely in a lake having sufficient depth to impart it a terminal velocity?
Options
Solution

Explanation:
When an iron sphere is falling freely into the lake, it will accelerate by the force due to gravity then its velocity increases continuously and resistance due to water causes a force called viscous force or upthrust (in fluids) which opposes its motion. It depends upon the velocity of object as the velocity increases upthrust increases. Hence during the fall of sphere first its velocity increases and then becomes constant after some depth.
This constant velocity is called terminal velocity, hence KE becomes constant beyond this depth, which is best represented by (b).


