Advertisements
Advertisements
Question
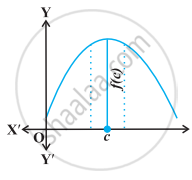
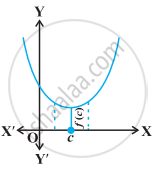
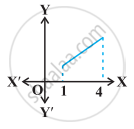
Which of the following graph represents the extreme value:-
Options


None of these
MCQ
Solution

Explanation:
Extreme Value:- If there exists a point 'C' in I such `f(c)` is either a maximum value or a minimum value in I, then `f` is having an extreme value in I. The point is `C` is said to be an extreme point.
shaalaa.com
Is there an error in this question or solution?
