Advertisements
Advertisements
Question
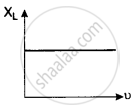
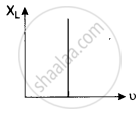
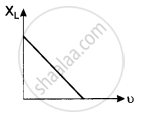
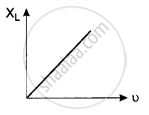
Which of the following graphs represents the correct variation of inductive reactance XL with frequency u?
Options
MCQ
Solution
shaalaa.com
Is there an error in this question or solution?
Which of the following graphs represents the correct variation of inductive reactance XL with frequency u?