Advertisements
Advertisements
Question
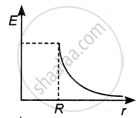
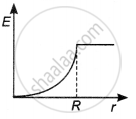
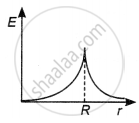
Which of the following graphs shows the variation of electric field E due to a hollow spherical conductor of radius R as a function of distance from the centre of the sphere?
Options
MCQ
Solution

Explanation:
Electric field due to a hollow spherical conductor is governed by equations E = 0, for r < R …(i)
and E = `"Q"/(4piepsilon_0"r"^2)` for r ≥ R ….(ii)
i.e. inside the conductor, electric field will be zero and outside the conductor it will vary according to E oc `1/"r"^2`.
shaalaa.com
Is there an error in this question or solution?


