Advertisements
Advertisements
Question
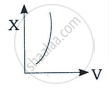
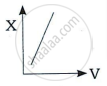
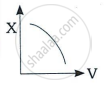
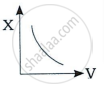
Which of the following graphs shows the variation of the fringe width with the frequency of light in a two source interference pattern?
Options
MCQ
Solution
shaalaa.com
Reflection of Waves
Is there an error in this question or solution?
