Advertisements
Advertisements
Question
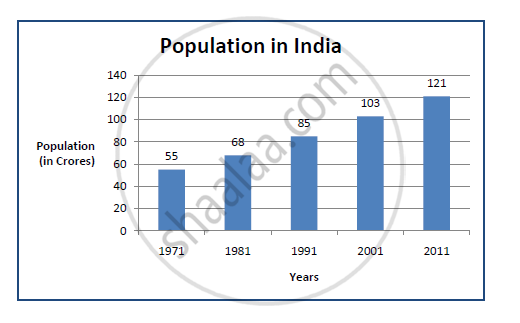
With the help of given statistical data prepare a simple bar graph:
India: Population
| Years | Population (in crores) |
| 1971 | 55 |
| 1981 | 68 |
| 1991 | 85 |
| 2001 | 103 |
| 2011 | 121 (Provisional) |
Solution

shaalaa.com
Concept on One Dimensional Diagrams
Is there an error in this question or solution?
APPEARS IN
RELATED QUESTIONS
Draw a simple line graph by using the following data:
Population of India
| Years | Population in millions |
| 1971 | 548 |
| 1981 | 683 |
| 1991 | 846 |
| 2001 | 1028 |
| 2011 | 1210 |
