Advertisements
Advertisements
Question
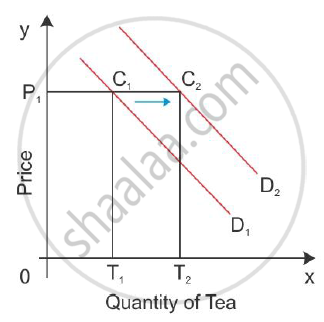
With the help of suitable diagram explain the meaning of rightward shift in the demand curve. Explain briefly any two of its determinants.
Solution
A change in demand means a shift in the demand curve. An increase in demand or a rightward shift in the demand curve is caused by a change in factors other than the price of the good. For example, if there is an increase in the price of a substitute good, say coffee, then the demand curve for tea shifts to the right. Thus, the consumer demand curve shifts from D1 to D2, consuming more of tea even when its price is constant.

Two determinants of demand:
- Increase in price of related commodity: The demand for any commodity depends on the prices of related commodities. For example, if the price of tea falls, the demand for coffee may decline because a consumer may now substitute tea for coffee.
- Increase in income of the consumer: A level of demand schedules also affects income changes. With an increase in income, a consumer will tend to buy more of any particular commodity. Hence, the demand schedule will shift to the right.
APPEARS IN
RELATED QUESTIONS
Complete the following demand schedule:
| Price (in ₹) | Quantity of mangoes demanded (in kg) |
| 350 | 2 |
| 300 | |
| 250 | |
| 200 | |
| 150 | |
| 100 |
The bus fare between two cities is reduced. How will this affect the demand curve for bus travel between the two cities?
The demand curve is generally ______.
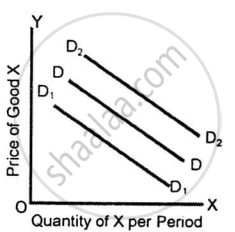
The diagram given below shows the original demand curve (DD) for good X, which is a complement of good Y:
If there is a rise in the price of good Y, which demand curve for good X is relevant?

State the impact of the following changes on the demand curve of a commodity:
increase in individual income
Shyam, Sita, Renu, Ahmed and John are five consumers of apples. Their demand for apples is given below. Derive the market demand schedule for apples.
| Price per Kg (in ₹) | Quantity Demanded (Apples) in Kg. | ||||
| Shyam | Sita | Renu | Ahmed | John | |
| 25.00 | 16 | 15 | 12 | 14 | 18 |
| 30.00 | 12 | 11 | 10 | 8 | 15 |
| 35.00 | 10 | 9 | 8 | 6 | 12 |
| 40.00 | 8 | 6 | 4 | 2 | 8 |
How is the market demand curve derived from the individual demand curves?
Define individual demand.
Define an individual demand schedule.
Define a market demand schedule.
