Advertisements
Advertisements
Question
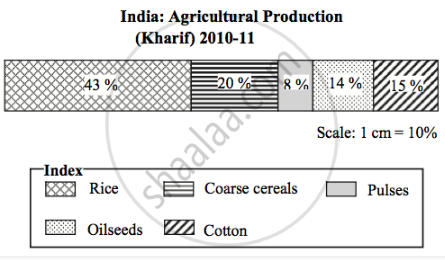
With the help of given statistical data prepare a Divided Rectangle Diagram:
Agricultural Production (2010 - 2011)
|
Crops
|
% (Percentage)
|
|
Rice
|
43
|
|
Coarse Cereals
|
20
|
|
Pulses
|
08
|
|
Oil-seeds
|
14
|
|
Cotton
|
15
|
|
Total
|
100
|
Solution
APPEARS IN
RELATED QUESTIONS
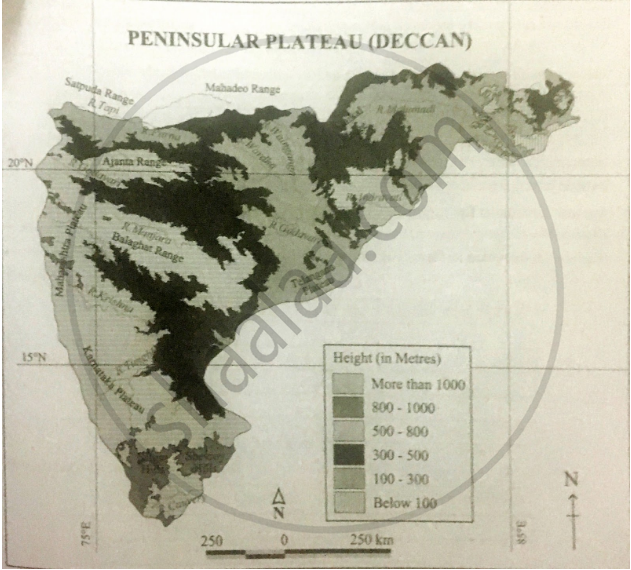
Observe the following map and answer the questions given below it (any two):

Questions:
(1) Name the states in the Peninsular Plateau.
(2) Name the Ghats to the coasts.
(3) Which plain lie in the state of Assam?
(4) Name the islands to the Bay of Bengal.
Mark the following in the outline map of India supplied to you. Write the names.
Give index (any two):
(1) Tropic of Cancer
(2) K-2
(3) Amritsar
(4) Chilka Lake
Observe the following map and answer the questions given below it (any two):

Questions:
(1) Which river has formed delta near Tamil Nadu Coast?
(2) Name any one gulf near Gujarat Coast.
(3) On which Ghat does Mount Kalsubai lie?
(4) Name the highest peak in the Western Ghats.
Show the following in the outline map of India supplied to you. Write the names and give index. (any two)
(1) Andaman and Nicobar Islands
(2) K-2
(3) Mumbai Port
(4) Ganga River
Observe the following map and answer the questions given below it.
(1) Name the westward flowing river.
(2) In which direction does river Godavari flow?
(3) Name the plateaus mentioned in the given map.
(4) Name the hills in the Karnataka Plateau.
Mark the following in the outline map of India supplied to you. Write the names. Give index.
