Advertisements
Advertisements
Question
Write Python code to plot a bar chart for India’s medal tally as shown below:
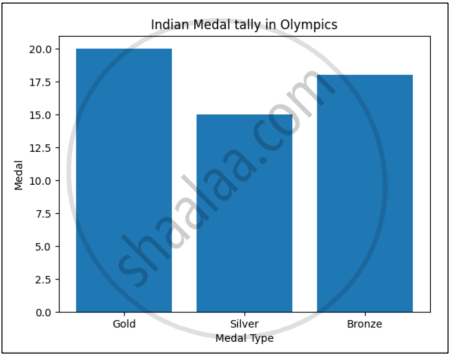
Also, give a suitable python statement to save this chart.
Solution
import matplotlib.pyplot as plt
Category=['Gold','Silver','Bronze']
Medal=[20,15,18]
plt.bar(Category,Medal)
plt.ylabel('Medal')
plt.xlabel('Medal Type')
plt.title('Indian Medal tally in Olympics')
plt.show()
Python statement to save the chart:
plt.savefig("aa.jpg")APPEARS IN
RELATED QUESTIONS
Assertion (A): Pie is a type of graph in which a circle is divided into different sectors and each sector represents a part of the whole.
Reason (R): The default False means each hist will be filled with color and True means each hist will be empty.
Which of the following is not a valid chart type?
Select code to plot a line chart using the given LIST:
import matplotlib. pyplot as PLINE
LIST = [10, 20, 30, 40, 50, 60]
Read the statements given below and identify the right option while drawing a Line Chart.
Statement A: While making line chart, it is compulsory to give legend location.
Statement B: If single list or array is provided to the plot() command, matplotlib assumes it is a sequence of y values.
Read the statements given below and identify the right option while drawing a Line Chart.
Statement A: While making line chart, legend can be placed at any location.
Statement B: It is complusory to provide x label and y label values.
Read the statements given below and identify the right option while drawing a Line Chart.
Statement A: In x axis, data must be in sorted manner (ascending or descending order).
Statement B: In y axis, values must be of integer data type only.
Read the statements given below and identify the right option while draw a Bar Graph.
Statement A: The bar graph can be plotted vertically only.
Statement B: Two parameters are compulsory while using bar() function.
Read the statements given below and identify the right option to draw a histogram.
Statement A: To make a Histogram with Matplotlib, we can use the plt.histogram() function.
Statement B: The default value of bin parameter is 10.
The command used to draw a bar graph horizontally is ______.
______ is the function to save the graph.
Write a python program to plot a line chart based on the given data to depict the changing weekly average temperature in Delhi for four weeks.
Week=[1,2,3,4]
Avg_week_temp=[40,42,38,44]
