Advertisements
Advertisements
Question
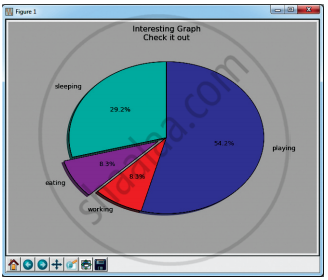
Write the plot for the following pie chart output.

Solution
‘import matplotlib.pyplot as pit
slices = [7,2,2,13]
activities = [‘sleeping’, ‘eating’, ‘working’, ‘playing’]
plt.pie(slices, labels = activities, autopct = ‘y.1.1 f % %‘)
plt.title(‘Interesting Graph check it out’)
plt.show( )
APPEARS IN
RELATED QUESTIONS
Draw the output for the following data visualization plot.
import matplotlib.pyplot as plt
plt.bar([1,3,5,7,9],[5,2,7,8,2], label="Example one") plt.bar([2,4,6,8,10],[8,6,2,5,6], label="Example two", color='g')
plt.legend()
plt.xlabel('bar number')
plt.ylabel('bar height')
plt.title('Epic Graph\nAnother Line! Whoa')
plt.show()
Write any three uses of data visualization.
Write the coding for the following:
To check if PIP is Installed on your PC.
Write the coding for the following:
To check the version of PIP installed on your PC.
Define Data Visualization.
List the general types of data visualization.
How will you install Matplotlib?
Read the following code: Identify the purpose of this code and choose the right option from the following.
C:\Users\YourName\AppData\Local\Programs\Python\Python36-32\Scripts>pip – version
Which key is used to run the module?
Identify the package manager for Python packages, or modules.
