Advertisements
Advertisements
प्रश्न
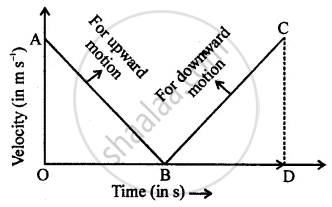
A ball is thrown up vertically and returns back to thrower in 6 s. Assuming there is no air friction, plot a graph between velocity and time. From the graph calculate
- deceleration
- acceleration
- total distance covered by ball
- average velocity.
उत्तर
A ball is thrown up vertically and returns to thrower in 6s. It means the ball takes 3s to reach the highest point and 3s to reach the earth from the highest point.

For the upward motion of a ball
u = ?
v = 0
a = −g = −10 ms−2
t = 3s
v = u + at
0 = u − 10(3)
u = 30 m/s
⇒ In the graph, OA = CD = 30 m/s
(i) When the ball moves upwards, then it decelerates.
From graph, deceleration = − slope of graph AB
= `-"OA"/"OB"=-30/3` = −10 ms−2
(ii) When ball falls downwards then acceleration = Slope of v.t. graph BC
= `"CD"/"BD"=30/3` = 10 ms−2
(iii) Total distance covered = area under v.t. graph
= ar(ΔOAB) + ar(ΔBCD)
= `1/2xx"OB"xx"OA" + 1/2xx"BD"xx"CD"`
= `1/2xx30xx3+1/2xx30xx3`
= 45 + 45
= 90 m
(iv) Ball returns back to thrower in 6s.
⇒ Displacement after 6s = 0
Average velocity = `"Time distance covered"/"Total time taken"=0/6` = 0
Average speed = `"Total distance covered"/"Total time taken"=90/6` = 15 ms−1
APPEARS IN
संबंधित प्रश्न
What can you say about the motion of a body if its speed-time graph is a straight line parallel to the time axis ?
The velocity-time graph for part of a train journey is a horizontal straight line. What does this tell you about its acceleration ?
A body with an initial velocity x moves with a uniform acceleration y. Plot its velocity-time graph.
Diagram shows a velocity – time graph for a car starting from rest. The graph has three sections AB, BC and CD.

Compare the distance travelled in section BC with the distance travelled in section AB.
How does the slope of a speed-time graph give the acceleration of a body moving along a straight line?
How will you use a speed-time graph to find whether the acceleration of the body is uniform or not?
Its time-displacement graph is a straight line.
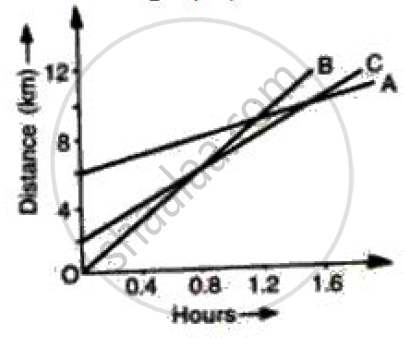
Figure shows the distance-time graph of three students A, B and C. On the basis of the graph, answer the following :
When B meets A, where is C?
Figure shows the distance-time graph of three students A, B and C. On the basis of the graph, answer the following :
How far did B travel between the time he passed C and A?
The slope of the speed–time graph gives ______.
