Advertisements
Advertisements
प्रश्न
उत्तर
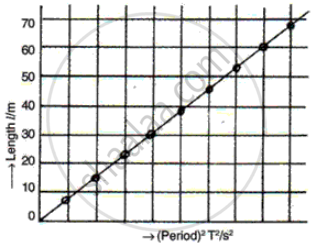
Graph of T2 versus I of a simple pendulum

The square of the time period is directly proportional to the effective length of a simple pendulum
APPEARS IN
संबंधित प्रश्न
If the length of a simple pendulum is made one-fourth, then its time period becomes
A pupil determines the velocity of sound as 320 ms−1. If the actual velocity of sound is 332 ms−1, calculate the percentage error.
Calculate the time period of a simple pendulum of length 0. 84 m when g = 9.8 ms−2.
State two factors which determine the time period of a simple pendulum.
What do you understand by the term graph?
State the two ratios of a scale, which are suitable for plotting points.
State two important precautions for drawing a graph line.
Define the following terms with reference to a simple pendulum:
Time period
