Advertisements
Advertisements
Question
A graph plotted by taking T2 on the Y-axis and L on the X-axis in an experiment of a simple pendulum is a straight line. What relationship between T2 and l, does this graph represent?
Graph
Solution
Graph of T2 versus I of a simple pendulum
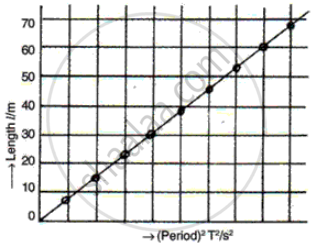
The square of the time period is directly proportional to the effective length of a simple pendulum
shaalaa.com
Simple Pendulum for Time
Is there an error in this question or solution?
APPEARS IN
RELATED QUESTIONS
What is a second's pendulum?
A student calculates experimentally the value of density of iron as 7.4 gcm−3. If the actual density of iron is 7.6 gcm−3, calculate the percentage error in the experiment.
The time period of the two pendulums are 2 s and 3 s respectively. Find the ratio of their lengths.
Define simple pendulum.
State the two ratios of a scale, which are suitable for plotting points.
State two important precautions for drawing a graph line.
What is a best fit line for a graph?
Complete the rollowing:
1 light year= ________ m
Calculate the length of a seconds pendulum at a place where g = 9.8 ms-2.
Define the following terms with reference to a simple pendulum:
Frequency
