Advertisements
Advertisements
प्रश्न
A population of 200 fruit flies is in Hardy Weinberg equilibrium. The frequency of the allele (a) 0.4. Calculate the following:
The number of homozygous recessive fruit flies.
उत्तर
In Hardy Weinberg, p2 + 2pq + q2 = 1, where 'p2' is the frequency of the homozygous dominant genotype (AA), '2pq' is the frequency of the heterozygous genotype (Aa), and 'q2' is the frequency of the homozygous recessive genotype (aa).
Given:
q = 0.4
We know p + q = 1
p = 1 − q
p = 1 − 0.4
p = 0.6
number of homozygous recessive fruit flies is
As, q2(aa) = (0.4)2
= 0.16
= 0.16 × 200
= 32
APPEARS IN
संबंधित प्रश्न
p2 + 2pq + q2 = 1. Explain this algebraic equation on the basis of Hardy Weinberg's principle.
With the help of an algebraic equation, how did Hardy-Weinberg explain that in a given population the frequency of occurrence of alleles of a gene is supposed to remain the same through generations?
In a population, Hardy Weinberg equilibrium is disturbed by following factors EXCEPT ______.
Hardy - Weinberg equilibrium is known to be affected by gene - flow, genetic drift, mutation, genetic recombination and
For the MN-blood group system, the frequencies of M and N alleles are 0.7 and 0.3, respectively. The expected frequency of MN-blood group bearing organisms is likely to be ______.
How is Hardy-Weinberg's expression “(p2 + 2pq + q2) = 1” derived?
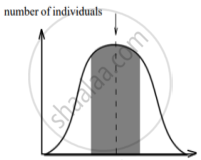
The graphs below show three types of natural selection. The shaded areas marked with arrows show the individuals in the population who are not selected. The dotted vertical lines show the statistical means.
 |
 |
 |
| character Graph A |
character Graph B |
character Graph C |
- What names are given to the types of selection shown in graphs A, B and C?
- After the selection has operated for several generations in the above populations indicated as, Graph A, B and C, graphically illustrate the probable results.
Write Hardy Weinberg's equation.
State Hardy Weinberg's principle.
The black colour on the beak of finches dominates over the yellow colour. There are 210 individuals with the genotype DD, 245 individuals with the genotype Dd and 45 individuals with the genotype dd. Deduce the frequency of individuals with dominant, heterozygous, and recessive traits.
