Advertisements
Advertisements
प्रश्न
Answer the question based on the information given in the following table. A, B, C, D, E denote companies and 2006, 2007, 2008. 2009& 2010 denote years.
| A | B | C | D | E | ||||||
| M | S | M | S | M | S | M | S | M | S | |
| 2006 | 2.8 | 1.3 | 3.3 | 2.2 | 2.6 | 1.7 | 3.0 | 2.2 | 1.9 | 1.4 |
| 2007 | 3.2 | 2.0 | 2.4 | 1.6 | 2.2 | 1.5 | 2.5 | 1.9 | 2.0 | 1.7 |
| 2008 | 1.9 | 0.9 | 2.9 | 1.6 | 2.1 | 1.0 | 2.3 | 1.5 | 1.6 | 1.1 |
| 2009 | 1.0 | 0.4 | 2.4 | 1.3 | 2.8 | 1.4 | 2.1 | 1.2 | 3.2 | 2.5 |
| 2010 | 2.5 | 1.5 | 2.3 | 1.2 | 2.6 | 2.1 | 1.8 | 1.1 | 3.1 | 2.6 |
The number of units sold by Company D in the year 2006 is what percent of the number of units manufactured by it in that year? (rounded off to two digits after decimal)
विकल्प
52.63
61.57
85.15
73.33
उत्तर
73.33
Explanation:
Number of units sold by company 'D' in 2006 = 2.2
Number of units manufactured by company D in 2006 = 3.00
∴ Percentage
APPEARS IN
संबंधित प्रश्न
Direction: Answer the question on the basis of the information given below.
The pie chart given below shows the percentage of print space allocation of articles printed on different sections of a newspaper.
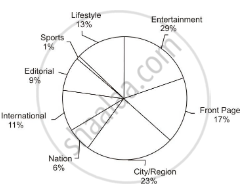
What percentage (approximately) more than the print space allocation for 'Editorial' in the print space allocation for 'Front Page'?
Answer the question based on the information given in the following table. A, B, C, D, E denote companies and 2006, 2007, 2008. 2009& 2010 denote years.
| A | B | C | D | E | ||||||
| M | S | M | S | M | S | M | S | M | S | |
| 2006 | 2.8 | 1.3 | 3.3 | 2.2 | 2.6 | 1.7 | 3.0 | 2.2 | 1.9 | 1.4 |
| 2007 | 3.2 | 2.0 | 2.4 | 1.6 | 2.2 | 1.5 | 2.5 | 1.9 | 2.0 | 1.7 |
| 2008 | 1.9 | 0.9 | 2.9 | 1.6 | 2.1 | 1.0 | 2.3 | 1.5 | 1.6 | 1.1 |
| 2009 | 1.0 | 0.4 | 2.4 | 1.3 | 2.8 | 1.4 | 2.1 | 1.2 | 3.2 | 2.5 |
| 2010 | 2.5 | 1.5 | 2.3 | 1.2 | 2.6 | 2.1 | 1.8 | 1.1 | 3.1 | 2.6 |
What is the total number of units manufactured by company C over me years together?
Answer the question based on the information given in the following table. A, B, C, D, E denote companies and 2006, 2007, 2008. 2009& 2010 denote years.
| A | B | C | D | E | ||||||
| M | S | M | S | M | S | M | S | M | S | |
| 2006 | 2.8 | 1.3 | 3.3 | 2.2 | 2.6 | 1.7 | 3.0 | 2.2 | 1.9 | 1.4 |
| 2007 | 3.2 | 2.0 | 2.4 | 1.6 | 2.2 | 1.5 | 2.5 | 1.9 | 2.0 | 1.7 |
| 2008 | 1.9 | 0.9 | 2.9 | 1.6 | 2.1 | 1.0 | 2.3 | 1.5 | 1.6 | 1.1 |
| 2009 | 1.0 | 0.4 | 2.4 | 1.3 | 2.8 | 1.4 | 2.1 | 1.2 | 3.2 | 2.5 |
| 2010 | 2.5 | 1.5 | 2.3 | 1.2 | 2.6 | 2.1 | 1.8 | 1.1 | 3.1 | 2.6 |
What is the average number of units sold by company D over all the years together?
The pie chart below shows the Indian Government’s interim budget allocation for the year 2019-2020 in percentage terms. All the questions below should be answered solely based on the pie chart below.

What percentage of the total budget has been earmarked for ‘Agriculture and Allied Activities’, ‘Subsidy-Fertilizer’ and ‘Subsidy-Food’, collectively?
The pie chart below shows the Indian Government’s interim budget allocation for the year 2019-2020 in percentage terms. All the questions below should be answered solely based on the pie chart below.
If the entire portion of the budget earmarked for Defence is split equally between ‘Transport’ and ‘Home Affairs’, what would be the new allocations for ‘Transport’ and ‘Home Affairs’ in percentage terms?
Point of intersection of axes in three dimension coordinate system is called
Most frequent occurring observation in data is called
Data presented in form of frequency data is known as
A cumulative frequency table is also known as
Two straight lines in same plane which never meet are called
