Advertisements
Advertisements
प्रश्न
Answer the question based on the information given in the following table. A, B, C, D, E denote companies and 2006, 2007, 2008. 2009& 2010 denote years.
| A | B | C | D | E | ||||||
| M | S | M | S | M | S | M | S | M | S | |
| 2006 | 2.8 | 1.3 | 3.3 | 2.2 | 2.6 | 1.7 | 3.0 | 2.2 | 1.9 | 1.4 |
| 2007 | 3.2 | 2.0 | 2.4 | 1.6 | 2.2 | 1.5 | 2.5 | 1.9 | 2.0 | 1.7 |
| 2008 | 1.9 | 0.9 | 2.9 | 1.6 | 2.1 | 1.0 | 2.3 | 1.5 | 1.6 | 1.1 |
| 2009 | 1.0 | 0.4 | 2.4 | 1.3 | 2.8 | 1.4 | 2.1 | 1.2 | 3.2 | 2.5 |
| 2010 | 2.5 | 1.5 | 2.3 | 1.2 | 2.6 | 2.1 | 1.8 | 1.1 | 3.1 | 2.6 |
The number of units sold by Company D in the year 2006 is what percent of the number of units manufactured by it in that year? (rounded off to two digits after decimal)
पर्याय
52.63
61.57
85.15
73.33
उत्तर
73.33
Explanation:
Number of units sold by company 'D' in 2006 = 2.2
Number of units manufactured by company D in 2006 = 3.00
∴ Percentage`=2.2/3xx100=73.33%`
APPEARS IN
संबंधित प्रश्न
Direction: Answer the question on the basis of the information given below.
The pie chart given below shows the percentage of print space allocation of articles printed on different sections of a newspaper.
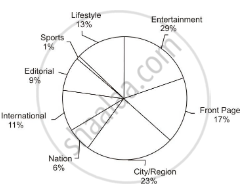
What percentage (approximately) more than the print space allocation for 'Editorial' in the print space allocation for 'Front Page'?
Direction: Answer the question on the basis of the information given below.
The table given below shows information about the toys manufactured by 6 different companies. Each company manufactures only two types of toys – vehicles and dolls. Among toy vehicles each company manufactures Cars and Trucks only. The table shows the number of toy vehicles as a percentage of total toys manufactured by each company. It also shows the ratio of Cars and Trucks manufactured. Each company manufactured a total of 50000 toys in a year.
| Company | Toy vehicles | Cars : Trucks |
| R | 50 % | 1:4 |
| S | 70% | 3:1 |
| T | 40% | 1:1 |
| U | 30% | 1:2 |
| V | 60% | 2:3 |
| W | 40% | 2:1 |
Which of the following options correctly represents the number of dolls, cars and trucks manufactured by company V?
Direction: Answer the question on the basis of the information given below.
The table given below shows information about the toys manufactured by 6 different companies. Each company manufactures only two types of toys – vehicles and dolls. Among toy vehicles each company manufactures Cars and Trucks only. The table shows the number of toy vehicles as a percentage of total toys manufactured by each company. It also shows the ratio of Cars and Trucks manufactured. Each company manufactured a total of 50000 toys in a year.
| Company | Toy vehicles | Cars : Trucks |
| R | 50 % | 1:4 |
| S | 70% | 3:1 |
| T | 40% | 1:1 |
| U | 30% | 1:2 |
| V | 60% | 2:3 |
| W | 40% | 2:1 |
Which of the following options is the closest to the average number of dolls manufactured by these six companies mentioned above?
Direction: Answer the question on the basis of the information given below.
The table given below shows information about the toys manufactured by 6 different companies. Each company manufactures only two types of toys – vehicles and dolls. Among toy vehicles each company manufactures Cars and Trucks only. The table shows the number of toy vehicles as a percentage of total toys manufactured by each company. It also shows the ratio of Cars and Trucks manufactured. Each company manufactured a total of 50000 toys in a year.
| Company | Toy vehicles | Cars : Trucks |
| R | 50 % | 1:4 |
| S | 70% | 3:1 |
| T | 40% | 1:1 |
| U | 30% | 1:2 |
| V | 60% | 2:3 |
| W | 40% | 2:1 |
What percentage of the total number of toys produced by company S is the total number of cars produced by the same company?
Answer the question based on the information given in the following table. A, B, C, D, E denote companies and 2006, 2007, 2008. 2009& 2010 denote years.
| A | B | C | D | E | ||||||
| M | S | M | S | M | S | M | S | M | S | |
| 2006 | 2.8 | 1.3 | 3.3 | 2.2 | 2.6 | 1.7 | 3.0 | 2.2 | 1.9 | 1.4 |
| 2007 | 3.2 | 2.0 | 2.4 | 1.6 | 2.2 | 1.5 | 2.5 | 1.9 | 2.0 | 1.7 |
| 2008 | 1.9 | 0.9 | 2.9 | 1.6 | 2.1 | 1.0 | 2.3 | 1.5 | 1.6 | 1.1 |
| 2009 | 1.0 | 0.4 | 2.4 | 1.3 | 2.8 | 1.4 | 2.1 | 1.2 | 3.2 | 2.5 |
| 2010 | 2.5 | 1.5 | 2.3 | 1.2 | 2.6 | 2.1 | 1.8 | 1.1 | 3.1 | 2.6 |
What is the approximate percent increase in the number of units sold by Company E in the year 2007 from the previous year?
Two equations that can be drawn as same line on graph then these equations are considered as
If two straight lines have same slope then these two lines are classified as
In a cumulative frequency polygon, frequencies are plotted against
Total of frequency up to an upper class limit or boundary is known as
Data presented in form of frequency data is known as
