Advertisements
Advertisements
प्रश्न
Answer the question based on the information given in the following table. A, B, C, D, E denote companies and 2006, 2007, 2008. 2009& 2010 denote years.
| A | B | C | D | E | ||||||
| M | S | M | S | M | S | M | S | M | S | |
| 2006 | 2.8 | 1.3 | 3.3 | 2.2 | 2.6 | 1.7 | 3.0 | 2.2 | 1.9 | 1.4 |
| 2007 | 3.2 | 2.0 | 2.4 | 1.6 | 2.2 | 1.5 | 2.5 | 1.9 | 2.0 | 1.7 |
| 2008 | 1.9 | 0.9 | 2.9 | 1.6 | 2.1 | 1.0 | 2.3 | 1.5 | 1.6 | 1.1 |
| 2009 | 1.0 | 0.4 | 2.4 | 1.3 | 2.8 | 1.4 | 2.1 | 1.2 | 3.2 | 2.5 |
| 2010 | 2.5 | 1.5 | 2.3 | 1.2 | 2.6 | 2.1 | 1.8 | 1.1 | 3.1 | 2.6 |
What is the approximate percent increase in the number of units sold by Company E in the year 2007 from the previous year?
पर्याय
17
36
27
21
उत्तर
21
Explanation:
Number of units sold bu company E in 2007 = 1.7
Number of units sold by company E in 2006 = 1.4
∴ Percentage increase
APPEARS IN
संबंधित प्रश्न
Direction: Answer the question on the basis of the information given below.
The table given below shows information about the toys manufactured by 6 different companies. Each company manufactures only two types of toys – vehicles and dolls. Among toy vehicles each company manufactures Cars and Trucks only. The table shows the number of toy vehicles as a percentage of total toys manufactured by each company. It also shows the ratio of Cars and Trucks manufactured. Each company manufactured a total of 50000 toys in a year.
| Company | Toy vehicles | Cars : Trucks |
| R | 50 % | 1:4 |
| S | 70% | 3:1 |
| T | 40% | 1:1 |
| U | 30% | 1:2 |
| V | 60% | 2:3 |
| W | 40% | 2:1 |
Which of the following options is the closest to the average number of dolls manufactured by these six companies mentioned above?
Direction: Answer the question on the basis of the information given below.
The following information is about the consumption of bread in five towns - A, B, C, D and E. Town A consumes a quarter of the total quantity of bread sold in all the five cities. The bread consumption of Town B is one-fourth of the consumption of Town C. The bread consumption of Town D is 12% of the total whereas Town E consumes 23% of the total.
There are only two companies - Bonbon and Modern - that sell bread in these five towns. The bar graph shows the sales of Bon-bon as a percentage of the total sale of bread in each city.
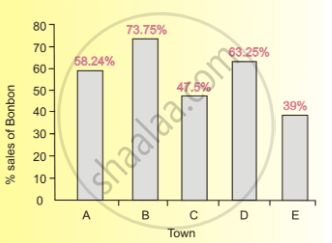
What was the total consumption of Bonbon bread in Towns A and B during a particular week when the total consumption of bread in Town D was 3600 loaves?
The pie chart below shows the Indian Government’s interim budget allocation for the year 2019-2020 in percentage terms. All the questions below should be answered solely based on the pie chart below.

If the Government’s budgetary allocation for ‘Pension’ is Rs. 1.7 lakh crore, which of the following is the closest approximation of the total budget amount of the Government?
In graphical representation of straight line, important attributes are
Point of intersection of axes in three dimension coordinate system is called
Minimum value in class limit is called
Total of frequency up to an upper class limit or boundary is known as
Data presented in form of frequency data is known as
Difference between maximum and minimum observation is called
Minimum and maximum values defined for a class or group is called
