Advertisements
Advertisements
प्रश्न
Birth rate and death rate.
उत्तर
| Birth Rate | Death Rate |
| it is the number of live births per thousand of population during a year for a particular region. | It is the number of deaths per thousand of population during a year for a particular region. |
| It is calculated using the following formula: CBR = Bi/P x lOOO Here, CBR = crude birth rate, Bi = Number of live births in a year, P = the estimated midyear population of that year. |
It is calculated using the following formula: CDR= D/P x lOOO Here, CDR = crude death rate, D = Number of deaths in a year, P = the estimated midyear population of that year. |
| If birth rate is more than death rate, it results in positive growth of population. | If death rate is more than birth rate it results in negative growth of population. |
APPEARS IN
संबंधित प्रश्न
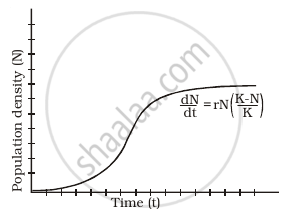
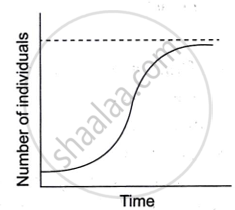
With the help of suitable diagram describe the logistic population growth curve.
If 8 individuals in a population of 80 butterflies die in a week, calculate the death rate of the population of butterflies during that period.
If the birth rate is greater than the death rate then the population ______.
Give Geographical Reason.
The real progress of a country is understood with the help of the Human Development Index.
Identify the correct correlation :
A: Assertion; R: Reasoning
A: Population of a region does not change.
R: Birth rate, death rate, and migration affect the population of a region.
India’s population as per 2011 census is:
Which one of the following is not a push factor?
How long did the world take to increase its population from 5 billion to 6 billion?
What is population growth? What does population change indicate for an area?
What are the components of population change?
What is the trend in growth of population over the years in the world?
Define the term ‘positive growth of population’.
Why do people migrate in large numbers from rural to urban areas in India?
The growth of population rate per decade is ______.
The continent that has the lowest growth rate of population.
Which one of the following is not a component of population change?
How many times the world population has increased during the last 500 years?
What is the present growth rate of population in the world?
Which of the following is not a push factor for migration?
The ten most populated countries have a ______ world population.
Which are the components of population change?
Which is the most populated country?
Which of these statements is not true?
Which of the following attributes has not been adversely affected by Age and Skill selective migration?
Consider the following statements and choose the correct option from the given options:
1. Population grown rapidly during the sixteenth and seventeenth centuries.
2. Expansion of world trade during the sixteenth and seventeenth centuries is an important cause of it.

From the given graph, what condition can you infer about the developed countries?
Study the given graph carefully and answer the following question:
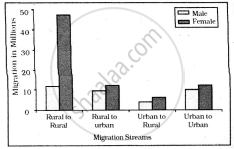
Intra-state Migration by place of Last Residence Indicating Migration Streams India, 2011
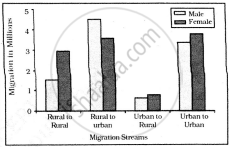
Inter-state Migration by Place of Last Residence Indicating Migration Streams India, 2011
Who dominates the intra-state migration of short distances?
Exponential growth in plants win be expressed as ______.
Which of the following statement is true?
(i) CBR = Bi/P × 1000
(ii) COR = D /P × 1000
(iii) If birth rate is more than death rate, then CBR results in positive growth of population.
The term Crude Birth Rate (CBR) is closest to which of the following?
Which of the following pairs is not correctly matched?
Which of the following forms the component of a nation?
India's population is larger than the total population of which of the following?
If a population of 50 Paramoecium present in a pool increases to 150 after an hour, what would be the growth rate of population?
What would be the per cent growth or birth rate per individual per hour for the same population mentioned in the previous question (Question 10)?
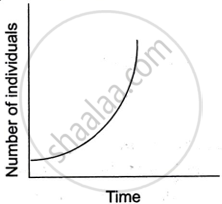
What would be the growth rate pattern, when the resources are unlimited?
Comment on the growth curve given below.
Swathi was growing a bacterial colony in a culture flask under ideal laboratory conditions where the resources are replenished. Which of the following equations will represent the growth in this case?
(Where population size is N, birth rate is b, death rate is d, unit time period is t, and carrying capacity is K).
Which of the following may be interpreted as a spontaneous effort to achieve a better balance between population and resources?
When will be the growth of population positive in any place and in which one of the following conditions?
Analyse the main features of Phase-III (1951 - 81) of growth of population in India.
Examine the different aspects of the growth of population in India during 1951-1981 and 1981-2021.
Analyse the different aspects of population growth in India during 1901-1921 and 1921-1951.
Consider the following and choose the correct answer with the help of given codes-
| STAGES OF POPULATION | GROWTH FEATURES |
| I Period between 1901 to 1921 | 1. Period of steady growth |
| II Period between 1921 to 1951 | 2. Phase of stagnant growth of Population |
| III Period between 1951 to 1981 | 3. High but decreasing growth rate |
| IV After 1981 till present | 4. Period of population explosion |
Assertion (A): Population of a region does not change.
Reasoning (R): Birth rate, death rate and migration affect the population of a region.
Which one of the following is the largest linguistic group of India?
Assertion (A): The population of a region does not change.
Reasoning (R): Birth rate, death rate and migration affect the population of a region.
A : Population of a region does not change.
R : Birth rate, death rate and migration affect the population of a region.
A: Assertion; R: Reasoning
A: The population of a region does not change.
R: Birth rate, death rate and migration affect the population of a region.
Assertion (A): Population of a region does not change.
Reasoning (R): Birth rate, death rate and migration affect the population of a region.
Assertion (A): Population of a region does not change.
Reasoning (R): Birth rate, death rate and migration affect the population of a region.
Assertion: Population of a region does not change.
Reason: Birth rate, death rate and migration affect the population of a region.
Assertion: Population of a region does not change.
Reason: Birth rate, death rate and migration affect the population of a region.
Assertion: Population of a region does not change.
Reasoning: Birth rate, death rate and migration affect the population of a region.
Study the two figures shown below that represent two growth models.
 |
 |
| Figure A | Figure B |
- Which one of the two figures represents an unlimited supply of nutrients? Give a reason.
- Which figure depicts a challenge to population growth?
- Explain the term reproductive fitness.
- Give the mathematical expressions for Figure A and Figure B.
Assertion (A): Population of a region does not change.
Reasoning (R): Birth rate, death rate and migration affect the population of a region.
Assertion : Population of a region does not change.
Reasoning : Birth rate, death rate and migration affect the population of a region.
Assertion (A): Population of a region does not change.
Reasoning (R): Birth rate, death rate and migration affect the population of a region.
