Advertisements
Advertisements
प्रश्न
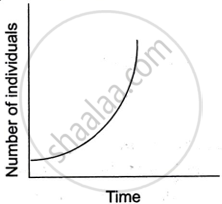
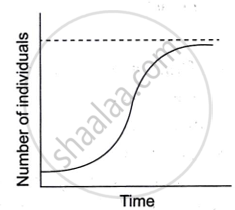
Study the two figures shown below that represent two growth models.
 |
 |
| Figure A | Figure B |
- Which one of the two figures represents an unlimited supply of nutrients? Give a reason.
- Which figure depicts a challenge to population growth?
- Explain the term reproductive fitness.
- Give the mathematical expressions for Figure A and Figure B.
उत्तर
- Population expansion in the J-shape, also known as the exponential growth curve, occurs when nutrients are abundant. Figure A depicts that circumstance. The population's per capita growth rate remains constant, regardless of population size.
-
Figure B depicts a challenge to population growth.
- Reproductive fitness assesses an individual's ability to pass on genes to the next generation through survival and reproduction. It plays an important role in determining which features become more widespread to a population due to natural selection.
-
Related mathematical expressions:
- mathematical expression for Figure A is
`("dN")/("dt")` = rN
Where N represents population size, t is time, r is the intrinsic rate of natural increase and `("dN")/("dt")` is the rate of change in population size over a certain time period. - The mathematical expression for Figure A is
`("dN")/("dt") = "rN" (("K - N")/"K")`
N is population size, t is time, r is the intrinsic rate of natural increase, K is carrying capacity and `("dN")/("dt")` is the rate of change in population size over time.
- mathematical expression for Figure A is
APPEARS IN
संबंधित प्रश्न
List any three important characteristics of a population and explain.
How long did the world take to increase its population from 5 billion to 6 billion?
The growth of population rate per decade is ______.
The continent that has the highest growth rate of population.
Which of the following attributes has not been adversely affected by Age and Skill selective migration?
A population of Paramoecium caudatum was grown in a culture medium. After 5 days the culture medium became overcrowed with Paramoeium and had depleted nutrients. What will happen to the population and what type of growth curve will the population attain? Draw the growth curve.

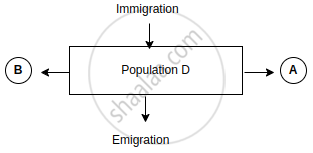
Observe the schematic representation given above and answer the following questions:
- Identify A and B.
- Calculate the growth rate of bacteria in a curd sample, where 1 million bacteria increased to two million, within a period of one hour.
A: The population of a region does not change.
R: Birth rate, death rate and migration affect the population of a region.
Assertion (A): Population of a region does not change.
Reasoning (R): Birth rate, death rate and migration affect the population of a region.
Assertion : Population of a region does not change.
Reasoning : Birth rate, death rate and migration affect the population of a region.
