Advertisements
Advertisements
Question
Study the two figures shown below that represent two growth models.
 |
 |
| Figure A | Figure B |
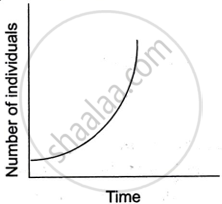
- Which one of the two figures represents an unlimited supply of nutrients? Give a reason.
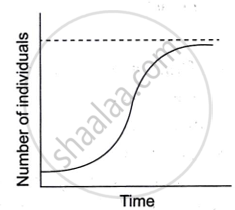
- Which figure depicts a challenge to population growth?
- Explain the term reproductive fitness.
- Give the mathematical expressions for Figure A and Figure B.
Solution
- Population expansion in the J-shape, also known as the exponential growth curve, occurs when nutrients are abundant. Figure A depicts that circumstance. The population's per capita growth rate remains constant, regardless of population size.
-
Figure B depicts a challenge to population growth.
- Reproductive fitness assesses an individual's ability to pass on genes to the next generation through survival and reproduction. It plays an important role in determining which features become more widespread to a population due to natural selection.
-
Related mathematical expressions:
- mathematical expression for Figure A is
`("dN")/("dt")` = rN
Where N represents population size, t is time, r is the intrinsic rate of natural increase and `("dN")/("dt")` is the rate of change in population size over a certain time period. - The mathematical expression for Figure A is
`("dN")/("dt") = "rN" (("K - N")/"K")`
N is population size, t is time, r is the intrinsic rate of natural increase, K is carrying capacity and `("dN")/("dt")` is the rate of change in population size over time.
- mathematical expression for Figure A is
APPEARS IN
RELATED QUESTIONS
If 8 individuals in a population of 80 butterflies die in a week, calculate the death rate of the population of butterflies during that period.
Examine the following statement and correct the incorrect one.
Greater economic prosperity indicates the development of a region.
What is the impact of migration?
What is the average sex ratio In India (2011)?
Population increased by the difference between births and deaths in a particular region between two points of time.
The country having lowest growth rate of population.
The ten most populated countries have a ______ world population.
On the basis of the demographic data of a country given below, construct an age pyramid and explain whether the population is stable, declining or growing.
| Age group | No. of individuals |
| Pre-reproductive | 20,000 |
| Reproductive | 15,000 |
| Post-reproductive | 10,000 |
Ratio between mortality and neutrality is called ______.
Crude Death Rate (CDR):-
