Advertisements
Advertisements
प्रश्न
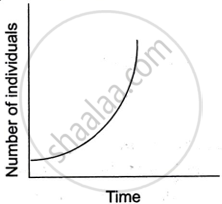
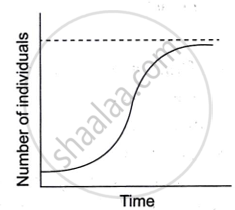
Study the two figures shown below that represent two growth models.
 |
 |
| Figure A | Figure B |
- Which one of the two figures represents an unlimited supply of nutrients? Give a reason.
- Which figure depicts a challenge to population growth?
- Explain the term reproductive fitness.
- Give the mathematical expressions for Figure A and Figure B.
उत्तर
- Population expansion in the J-shape, also known as the exponential growth curve, occurs when nutrients are abundant. Figure A depicts that circumstance. The population's per capita growth rate remains constant, regardless of population size.
-
Figure B depicts a challenge to population growth.
- Reproductive fitness assesses an individual's ability to pass on genes to the next generation through survival and reproduction. It plays an important role in determining which features become more widespread to a population due to natural selection.
-
Related mathematical expressions:
- mathematical expression for Figure A is
`("dN")/("dt")` = rN
Where N represents population size, t is time, r is the intrinsic rate of natural increase and `("dN")/("dt")` is the rate of change in population size over a certain time period. - The mathematical expression for Figure A is
`("dN")/("dt") = "rN" (("K - N")/"K")`
N is population size, t is time, r is the intrinsic rate of natural increase, K is carrying capacity and `("dN")/("dt")` is the rate of change in population size over time.
- mathematical expression for Figure A is
APPEARS IN
संबंधित प्रश्न
What is ‘carrying capacity’ of a species in a habitat ? Why is logistic growth model considered more realistic?
What is the impact of migration?
What is the impact of migration?
In how many years India's population will be doubled?
The country having lowest growth rate of population.
In an exponential bacterial culture, the number of cells/ml is plotted o half log group. The growth is ______.
The term Crude Birth Rate (CBR) is closest to which of the following?
Consider the following and choose the correct answer with the help of given codes-
| STAGES OF POPULATION | GROWTH FEATURES |
| I Period between 1901 to 1921 | 1. Period of steady growth |
| II Period between 1921 to 1951 | 2. Phase of stagnant growth of Population |
| III Period between 1951 to 1981 | 3. High but decreasing growth rate |
| IV After 1981 till present | 4. Period of population explosion |
A: Population of a region does not change.
R: Birth rate, death rate and migration affect the population of a region.
Assertion: Population of a region does not change.
Reason: Birth rate, death rate and migration affect the population of a region.
