Advertisements
Advertisements
प्रश्न
Decide which of the following statements is true and which is false. Give reasons for your answer.
A point whose y-coordinate is zero, will lie on x-axis.
उत्तर
The examples of points having y-coordinate as zero are (3,0), (6,0), (9,0). This can be represented in the following manner:
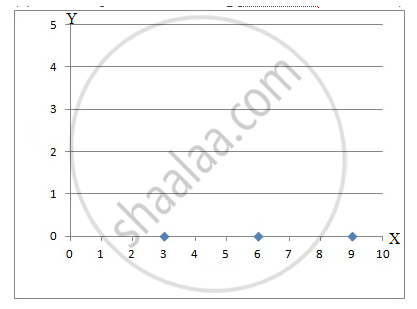
From figure above, it can be seen that these points lie on the x-axis. Hence, the statement is true.
APPEARS IN
संबंधित प्रश्न
State whether True or False. Correct those are false.
A point whose x coordinate is zero and y-coordinate is non-zero will lie on the y-axis.
Locate the points:
(2, 1), (2, 2), (2, 3), (2, 4)
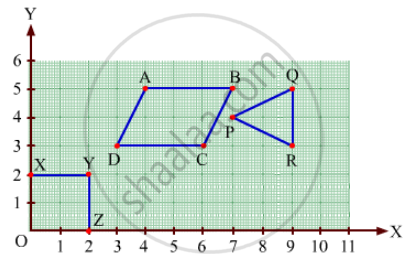
Write the coordinates of each of the vertices of each polygon in Fig. 27.9.
We need ______ coordinates for representing a point on the graph sheet.
Plot the given points on a graph sheet.
- (5, 4)
- (2, 0)
- (3, 1)
- (0, 4)
- (4, 5)
Plot the given points on a graph sheet and check if the points lie on a straight line. If not, name the shape they form when joined in the given order.
(1, 2), (2, 4), (3, 6), (4, 8)
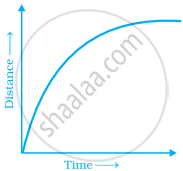
Explain the situations represented by the following distance-time graph.
Draw the line graph using suitable scale to show the annual gross profit of a company for a period of five years.
| Year | 1st | 2nd | 3rd | 4th | 5th |
| Gross Profit (in Rs) |
17,00,000 | 15,50,000 | 11,40,000 | 12,10,000 | 14,90,000 |
The table shows the data collected for Dhruv’s walking on a road.
| Time (in minutes) |
0 | 5 | 10 | 15 | 20 | 25 |
| Distance (in km) |
0 | 0.5 | 1 | 1.25 | 1.5 | 1.75 |
- Plot a line graph for the given data using a suitable scale.
- In what time periods did Dhruv make the most progress?
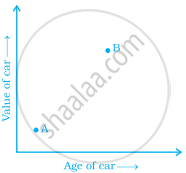
The two graphs below compare Car A and Car B. The left graph shows the relationship between age and value. The right graph shows the relationship between size and maximum speed.
 |
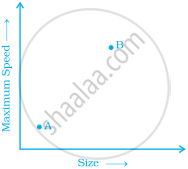 |
Use the graphs to determine whether each statement is true or false, and explain your answer.
- The older car is less valuable.
- The faster car is larger.
- The larger car is older.
- The faster car is older.
- The more valuable car is slower.
