Advertisements
Chapters
2: Powers
3: Squares and Square Roots
4: Cubes and Cube Roots
5: Playing with Numbers
6: Algebraic Expressions and Identities
7: Factorization
8: Division of Algebraic Expressions
9: Linear Equation in One Variable
10: Direct and Inverse Variations
11: Time and Work
12: Percentage
13: Proft, Loss, Discount and Value Added Tax (VAT)
14: Compound Interest
15: Understanding Shapes-I (Polygons)
16: Understanding Shapes-II (Quadrilaterals)
17: Understanding Shapes-III (Special Types of Quadrilaterals)
18: Practical Geometry (Constructions)
19: Visualising Shapes
20: Mensuration - I (Area of a Trapezium and a Polygon)
21: Mensuration - II (Volumes and Surface Areas of a Cuboid and a Cube)
22: Mensuration - III (Surface Area and Volume of a Right Circular Cylinder)
23: Data Handling-I (Classification and Tabulation of Data)
24: Data Handling-II (Graphical Representation of Data as Histograms)
25: Data Handling-III (Pictorial Representation of Data as Pie Charts or Circle Graphs)
26: Data Handling-IV (Probability)
▶ 27: Introduction to Graphs
![RD Sharma solutions for Mathematics [English] Class 8 chapter 27 - Introduction to Graphs RD Sharma solutions for Mathematics [English] Class 8 chapter 27 - Introduction to Graphs - Shaalaa.com](/images/9788189928049-mathematics-english-class-8_6:d71f9951bde04f9981d965449678818b.jpg)
Advertisements
Solutions for Chapter 27: Introduction to Graphs
Below listed, you can find solutions for Chapter 27 of CBSE RD Sharma for Mathematics [English] Class 8.
RD Sharma solutions for Mathematics [English] Class 8 27 Introduction to Graphs Exercise 27.1 [Pages 5 - 7]
Plot the points (5, 0), (5, 1), (5, 8). Do they lie on a line? What is your observation?
Plot the points (2, 8), (7, 8) and (12, 8). Join these points in pairs. Do they lie on a line? What do you observe?
Locate the points:
(1, 1), (1, 2), (1, 3), (1, 4)
Locate the points:
(2, 1), (2, 2), (2, 3), (2, 4)
Locate the points:
(1, 3), (2, 3), (3, 3), (4, 3)
Locate the points:
(1, 4), (2, 4), (3, 4), (4, 4).
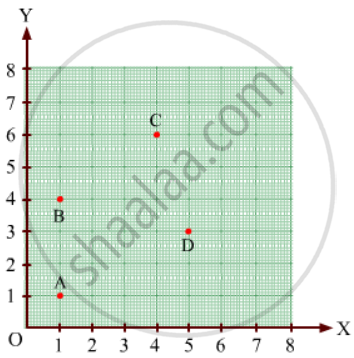
Find the coordinates of points A, B, C, D in Fig. 27.7.

Find the coordinates of points P, Q, R and S in Fig. 27.8.

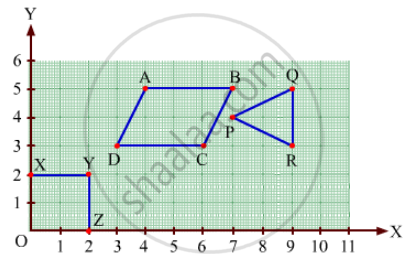
Write the coordinates of each of the vertices of each polygon in Fig. 27.9.

Decide which of the following statement is true and which is false. Give reasons for your answer.
A point whose x-coordinate is zero, will lie on the y-axis.
Decide which of the following statements is true and which is false. Give reasons for your answer.
A point whose y-coordinate is zero, will lie on x-axis.
Decide which of the following statements is true and which is false. Give reasons for your answer.
The coordinates of the origin are (0, 0).
Decide which of the following statements is true and which is false. Give reasons for your answer.
Points whose x and y coordinates are equal, lie on a line passing through the origin.
RD Sharma solutions for Mathematics [English] Class 8 27 Introduction to Graphs Exercise 27.2 [Pages 15 - 16]
The following table shows the number of patients discharged from a hospital with HIV diagnosis in different years:
| Years: | 2002 | 2003 | 2004 | 2005 | 2006 |
| Number of patients: | 150 | 170 | 195 | 225 | 230 |
Represent this information by a graph.
The following table shows the amount of rice grown by a farmer in different years:
| Years: | 2000 | 2001 | 2002 | 2003 | 2004 | 2005 | 2006 |
| Rice grown (in quintals): | 200 | 180 | 240 | 260 | 250 | 200 | 270 |
Plot a graph to illustrate this information.
The following table gives the information regarding the number of persons employed to a piece of work and time taken to complete the work:
| Number of persons: | 2 | 4 | 6 | 8 |
| Time taken (in days): | 12 | 6 | 4 | 3 |
Plot a graph of this information.
The following table gives the information regarding length of a side of a square and its area:
| Length of a side (in cm): | 1 | 2 | 3 | 4 | 5 |
| Area of square (in cm2): | 1 | 4 | 9 | 16 | 25 |
Draw a graph to illustrate this information.
The following table shows the sales of a commodity during the years 2000 to 2006.
| Years: | 2000 | 2001 | 2002 | 2003 | 2004 | 2005 | 2006 |
| Sales (in lakhs of Rs): | 1.5 | 1.8 | 2.4 | 3.2 | 5.4 | 7.8 | 8.6 |
Draw a graph of this information.
Draw the temperature-time graph in each of the following cases:
| Time (in hours): | 7:00 | 9:00 | 11:00 | 13:00 | 15:00 | 17:00 | 19:00 | 21:00 |
| Temperature (°F) in: | 100 | 101 | 104 | 102 | 100 | 99 | 100 | 98 |
Draw the temperature-time graph in each of the following cases:
| Time (in hours): | 8:00 | 10:00 | 12:00 | 14:00 | 16:00 | 18:00 | 20:00 |
| Temperature (°F) in: | 100 | 101 | 104 | 103 | 99 | 98 | 100 |
Draw the velocity-time graph from the following data:
| Time (in hours): | 7:00 | 8:00 | 9:00 | 10:00 | 11:00 | 12:00 | 13:00 | 14:00 |
| Speed (in km/hr): | 30 | 45 | 60 | 50 | 70 | 50 | 40 | 45 |
The runs scored by a cricket team in first 15 overs are given below:
| Overs: | I | II | III | IV | V | VI | VII | VIII | IX | X | XI | XII | XIII | XIV | XV |
| Runs: | 2 | 1 | 4 | 2 | 6 | 8 | 10 | 21 | 5 | 8 | 3 | 2 | 6 | 8 | 12 |
Draw the graph representing the above data in two different ways as a graph and as a bar chart.
The runs scored by two teams A and B in first 10 overs are given below:
| Overs: | I | II | III | IV | V | VI | VII | VIII | IX | X |
| Team A: | 2 | 1 | 8 | 9 | 4 | 5 | 6 | 10 | 6 | 2 |
| Team B: | 5 | 6 | 2 | 10 | 5 | 6 | 3 | 4 | 8 | 10 |
Draw a graph depicting the data, making the graphs on the same axes in each case in two different ways as a graph and as a bar chart.
Solutions for 27: Introduction to Graphs
![RD Sharma solutions for Mathematics [English] Class 8 chapter 27 - Introduction to Graphs RD Sharma solutions for Mathematics [English] Class 8 chapter 27 - Introduction to Graphs - Shaalaa.com](/images/9788189928049-mathematics-english-class-8_6:d71f9951bde04f9981d965449678818b.jpg)
RD Sharma solutions for Mathematics [English] Class 8 chapter 27 - Introduction to Graphs
Shaalaa.com has the CBSE Mathematics Mathematics [English] Class 8 CBSE solutions in a manner that help students grasp basic concepts better and faster. The detailed, step-by-step solutions will help you understand the concepts better and clarify any confusion. RD Sharma solutions for Mathematics Mathematics [English] Class 8 CBSE 27 (Introduction to Graphs) include all questions with answers and detailed explanations. This will clear students' doubts about questions and improve their application skills while preparing for board exams.
Further, we at Shaalaa.com provide such solutions so students can prepare for written exams. RD Sharma textbook solutions can be a core help for self-study and provide excellent self-help guidance for students.
Concepts covered in Mathematics [English] Class 8 chapter 27 Introduction to Graphs are Concept of Bar Graph, Concept of Pie Graph (Or a Circle-graph), Graphical Representation of Data as Histograms, Concept of a Line Graph, Linear Graphs, Interpretation of Bar Graphs, Drawing a Bar Graph, Concept of Double Bar Graph, Interpretation of a Double Bar Graph, Drawing a Double Bar Graph, Some Application of Linear Graphs.
Using RD Sharma Mathematics [English] Class 8 solutions Introduction to Graphs exercise by students is an easy way to prepare for the exams, as they involve solutions arranged chapter-wise and also page-wise. The questions involved in RD Sharma Solutions are essential questions that can be asked in the final exam. Maximum CBSE Mathematics [English] Class 8 students prefer RD Sharma Textbook Solutions to score more in exams.
Get the free view of Chapter 27, Introduction to Graphs Mathematics [English] Class 8 additional questions for Mathematics Mathematics [English] Class 8 CBSE, and you can use Shaalaa.com to keep it handy for your exam preparation.
