Advertisements
Chapters
2: Powers
3: Squares and Square Roots
4: Cubes and Cube Roots
5: Playing with Numbers
6: Algebraic Expressions and Identities
7: Factorization
8: Division of Algebraic Expressions
9: Linear Equation in One Variable
10: Direct and Inverse Variations
11: Time and Work
12: Percentage
13: Proft, Loss, Discount and Value Added Tax (VAT)
14: Compound Interest
15: Understanding Shapes-I (Polygons)
16: Understanding Shapes-II (Quadrilaterals)
17: Understanding Shapes-III (Special Types of Quadrilaterals)
18: Practical Geometry (Constructions)
19: Visualising Shapes
20: Mensuration - I (Area of a Trapezium and a Polygon)
21: Mensuration - II (Volumes and Surface Areas of a Cuboid and a Cube)
22: Mensuration - III (Surface Area and Volume of a Right Circular Cylinder)
23: Data Handling-I (Classification and Tabulation of Data)
24: Data Handling-II (Graphical Representation of Data as Histograms)
▶ 25: Data Handling-III (Pictorial Representation of Data as Pie Charts or Circle Graphs)
26: Data Handling-IV (Probability)
27: Introduction to Graphs
![RD Sharma solutions for Mathematics [English] Class 8 chapter 25 - Data Handling-III (Pictorial Representation of Data as Pie Charts or Circle Graphs) RD Sharma solutions for Mathematics [English] Class 8 chapter 25 - Data Handling-III (Pictorial Representation of Data as Pie Charts or Circle Graphs) - Shaalaa.com](/images/9788189928049-mathematics-english-class-8_6:d71f9951bde04f9981d965449678818b.jpg)
Advertisements
Solutions for Chapter 25: Data Handling-III (Pictorial Representation of Data as Pie Charts or Circle Graphs)
Below listed, you can find solutions for Chapter 25 of CBSE RD Sharma for Mathematics [English] Class 8.
RD Sharma solutions for Mathematics [English] Class 8 25 Data Handling-III (Pictorial Representation of Data as Pie Charts or Circle Graphs) Exercise 25.1 [Pages 12 - 14]
The number of hours, spent by a school boy on different activities in a working day, is given below:
| Activities | Sleep | School | Home | Play | Others | Total |
| Number of hours | 8 | 7 | 4 | 2 | 3 | 24 |
Present the information in the form of a pie-chart.
Employees of a company have been categorized according to their religions as given below:
| Religions | Hindu | Muslim | Sikh | Christian | Total |
| Number of workers | 420 | 300 | 225 | 105 | 1080 |
Draw a pie-chart to represent the above information.
In one day the sales (in rupees) of different items of a baker's shop are given below:
| Items | Ordinary bread | Fruit bread | Cakes and Pastries | Biscuits | Others | Total |
| Sales (in Rs) | 260 | 40 | 100 | 60 | 20 | 480 |
Draw a pie-chart representing the above sales.
The following data shows the expenditure of a person on different items during a month. Represent the data by a pie-chart.
| Items of expenditure | Rent | Education | Food | Clothing | Others |
| Amount (in Rs) | 2700 | 1800 | 2400 | 1500 | 2400 |
The percentages of various categories of workers in a state are given in the following table.
| Categoies | Culti-vators | Agricultural Labourers | Industrial Workers | Commercial Workers | Others |
| % of workers | 40 | 25 | 12.5 | 10 | 12.5 |
Present the information in the form a pie-chart.
The following table shows the expenditure incurred by a publisher in publishing a book:
| Items | Paper | Printing | Binding | Advertising | Miscellaneous |
| Expenditure (in%) | 35% | 20% | 10% | 5% | 30% |
Present the above data in the form of a pie-chart.
Percentage of the different products of a village in a particular district are given below. Draw a pie-chart representing this information.
| Items | Wheat | Pulses | Jwar | Grounnuts | Vegetables | Total |
| % | `125/3` | `125/6` | `25/2` | `50/3` | `25/3` | 100 |
Draw a pie-diagram for the following data of expenditure pattern in a family:
| Items | Food | Clothing | Rent | Education | Unforeseen events | Midicine |
| Expenditure (in percent) | 40% | 20% | 10% | 10% | 15% | 5% |
Draw a pie-diagram of the areas of continents of the world given in the following table:
| Continents | Asia | U.S.S.R | Africa | Europe | Noth America | South America | Australia |
| Area (in million sq. km) |
26.9 | 20.5 | 30.3 | 4.9 | 24.3 | 17.9 | 8.5 |
The following data gives the amount spent on the construction of a house. Draw a pie diagram.
| Items | Cement | Timber | Bricks | Labour | Steel | Miscellaneous |
| Expenditure (in thousand Rs) |
60 | 30 | 45 | 75 | 45 | 45 |
The following table shows how a student spends his pocket money during the course of a month. Represent it by a pie-diagram.
| Items | Food | Entertainment | Other expenditure | Savings |
| Expenditure | 40% | 25% | 20% | 15% |
Represent the following data by a pie-diagram:
| Items of expenditure | Expenditure | |
| Family A | Family B | |
| Food | 4000 | 6400 |
| Clothing | 2500 | 480 |
| Rent | 1500 | 3200 |
| Education | 400 | 1000 |
| Miscellaneous | 1600 | 600 |
| Total | 10000 | 16000 |
Following data gives the break up of the cost of production of a book:
| Printing | Paper | Binding charges | Advertisement | Royalty | Miscellaneous |
| 30% | 15% | 15% | 20% | 10% | 15% |
Draw a pie- diagram depicting the above information.
Represent the following data with the help of a pie-diagram:
| Items | Wheat | Rice | Tea |
| Production (in metric tons) | 3260 | 1840 | 900 |
Draw a pie-diagram representing the relative frequencies (expressed as percentage) of the eight classes as given below:
12.6, 18.2, 17.5, 20.3, 2.8, 4.2, 9.8, 14.7
Following is the break up of the expenditure of a family on different items of consumption:
| Items | Food | Clothing | Rent | Education | Fuel etc. | Medicine | Miscellaneous |
| Expenditure (in Rs) | 1600 | 200 | 600 | 150 | 100 | 80 | 270 |
Draw a pie-diagram to represent the above data.
Draw a pie-diagram for the following data of the investment pattern in a five year plan:
| Agriculture | Irrigation and Power | Small Industries | Transport | Social service | Miscellaneous |
| 14% | 16% | 29% | 17% | 16% | 8% |
RD Sharma solutions for Mathematics [English] Class 8 25 Data Handling-III (Pictorial Representation of Data as Pie Charts or Circle Graphs) Exercise 25.2 [Pages 21 - 23]
The pie-chart given in the following represents the expenditure on different items in constructing a flat in Delhi. If the expenditure incurred on cement is Rs 112500, find the following:

(i) Total cost of the flat.
(ii) Expenditure incurred on labour.
The pie-chart given in the following shows the annual agricultural production of an Indian state. If the total production of all the commodities is 81000 tonnes, find the production (in tonnes) of
(i) Wheat
(ii) Sugar
(iii) Rice
(iv) Maize
(v) Gram

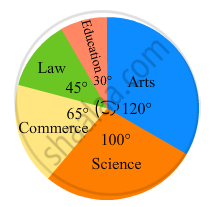
The following pie-chart shows the number of students admitted in different faculties of a college. If 1000 students are admitted in Science answer the following:

(i) What is the total number of students?
(ii) What is the ratio of students in science and arts?
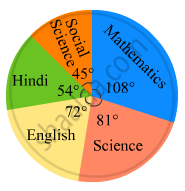
In the following figure, the pie-chart shows the marks obtained by a student in an examination. If the student secures 440 marks in all, calculate his marks in each of the given subjects.

In the following figure, the pie-chart shows the marks obtained by a student in various subjects. If the student scored 135 marks in mathematics, find the total marks in all the subjects. Also, find his score in individual subjects.

The following pie-chart shows the monthly expenditure of Shikha on various items. If she spends Rs 16000 per month, answer the following questions:

(i) How much does she spend on rent?
(ii) How much does she spend on education?
(iii) What is the ratio of expenses on food and rent?
The pie chart (as shown in the figure 25.23) represents the amount spent on different sports by a sports club in a year. If the total money spent by the club on sports is Rs 1,08,000, find the amount spent on each sport.

Solutions for 25: Data Handling-III (Pictorial Representation of Data as Pie Charts or Circle Graphs)
![RD Sharma solutions for Mathematics [English] Class 8 chapter 25 - Data Handling-III (Pictorial Representation of Data as Pie Charts or Circle Graphs) RD Sharma solutions for Mathematics [English] Class 8 chapter 25 - Data Handling-III (Pictorial Representation of Data as Pie Charts or Circle Graphs) - Shaalaa.com](/images/9788189928049-mathematics-english-class-8_6:d71f9951bde04f9981d965449678818b.jpg)
RD Sharma solutions for Mathematics [English] Class 8 chapter 25 - Data Handling-III (Pictorial Representation of Data as Pie Charts or Circle Graphs)
Shaalaa.com has the CBSE Mathematics Mathematics [English] Class 8 CBSE solutions in a manner that help students grasp basic concepts better and faster. The detailed, step-by-step solutions will help you understand the concepts better and clarify any confusion. RD Sharma solutions for Mathematics Mathematics [English] Class 8 CBSE 25 (Data Handling-III (Pictorial Representation of Data as Pie Charts or Circle Graphs)) include all questions with answers and detailed explanations. This will clear students' doubts about questions and improve their application skills while preparing for board exams.
Further, we at Shaalaa.com provide such solutions so students can prepare for written exams. RD Sharma textbook solutions can be a core help for self-study and provide excellent self-help guidance for students.
Concepts covered in Mathematics [English] Class 8 chapter 25 Data Handling-III (Pictorial Representation of Data as Pie Charts or Circle Graphs) are Graphical Representation of Data as Histograms, Organisation of Data, Concept of Data Handling, Drawing a Bar Graph, Drawing a Double Bar Graph, Interpretation of a Double Bar Graph, Frequency Distribution Table, Concept of Pie Graph (Or a Circle-graph), Interpretation of Pie Diagram, Chance and Probability - Chance, Interpretation of a Pictograph, Interpretation of Bar Graphs, Basic Ideas of Probability.
Using RD Sharma Mathematics [English] Class 8 solutions Data Handling-III (Pictorial Representation of Data as Pie Charts or Circle Graphs) exercise by students is an easy way to prepare for the exams, as they involve solutions arranged chapter-wise and also page-wise. The questions involved in RD Sharma Solutions are essential questions that can be asked in the final exam. Maximum CBSE Mathematics [English] Class 8 students prefer RD Sharma Textbook Solutions to score more in exams.
Get the free view of Chapter 25, Data Handling-III (Pictorial Representation of Data as Pie Charts or Circle Graphs) Mathematics [English] Class 8 additional questions for Mathematics Mathematics [English] Class 8 CBSE, and you can use Shaalaa.com to keep it handy for your exam preparation.
