Advertisements
Chapters
2: Powers
3: Squares and Square Roots
4: Cubes and Cube Roots
5: Playing with Numbers
6: Algebraic Expressions and Identities
7: Factorization
8: Division of Algebraic Expressions
9: Linear Equation in One Variable
10: Direct and Inverse Variations
11: Time and Work
12: Percentage
13: Proft, Loss, Discount and Value Added Tax (VAT)
14: Compound Interest
15: Understanding Shapes-I (Polygons)
16: Understanding Shapes-II (Quadrilaterals)
17: Understanding Shapes-III (Special Types of Quadrilaterals)
18: Practical Geometry (Constructions)
19: Visualising Shapes
20: Mensuration - I (Area of a Trapezium and a Polygon)
21: Mensuration - II (Volumes and Surface Areas of a Cuboid and a Cube)
22: Mensuration - III (Surface Area and Volume of a Right Circular Cylinder)
23: Data Handling-I (Classification and Tabulation of Data)
▶ 24: Data Handling-II (Graphical Representation of Data as Histograms)
25: Data Handling-III (Pictorial Representation of Data as Pie Charts or Circle Graphs)
26: Data Handling-IV (Probability)
27: Introduction to Graphs
![RD Sharma solutions for Mathematics [English] Class 8 chapter 24 - Data Handling-II (Graphical Representation of Data as Histograms) RD Sharma solutions for Mathematics [English] Class 8 chapter 24 - Data Handling-II (Graphical Representation of Data as Histograms) - Shaalaa.com](/images/9788189928049-mathematics-english-class-8_6:d71f9951bde04f9981d965449678818b.jpg)
Advertisements
Solutions for Chapter 24: Data Handling-II (Graphical Representation of Data as Histograms)
Below listed, you can find solutions for Chapter 24 of CBSE RD Sharma for Mathematics [English] Class 8.
RD Sharma solutions for Mathematics [English] Class 8 24 Data Handling-II (Graphical Representation of Data as Histograms) Exercise 24.1 [Pages 5 - 8]
Given below is the frequency distribution of the heights of 50 students of a class:
| Class interval: | 140−145 | 145−150 | 150−155 | 155−160 | 160−165 |
| Frequency: | 8 | 12 | 18 | 10 | 5 |
Draw a histogram representing the above data.
Draw a histogram of the following data:
| Class interval: | 10−15 | 15−20 | 20−25 | 25−30 | 30−35 | 34−40 |
| Frequency: | 30 | 98 | 80 | 58 | 29 | 50 |
Number of workshops organized by a school in different areas during the last five years are as follows:
| Years | No. of workshops |
| 1995−1996 | 25 |
| 1996−1997 | 30 |
| 1997−1998 | 42 |
| 1998−1999 | 50 |
| 1999−2000 | 65 |
Draw a histogram representing the above data.
In a hypothetical sample of 20 people the amounts of money with them were found to be as follows:
114, 108, 100, 98, 101, 109, 117, 119, 126, 131, 136, 143, 156, 169, 182, 195, 207, 219, 235, 118.
Draw the histogram of the frequency distribution (taking one of the class intervals as 50 − 100).
Construct a histogram for the following data:
| Monthly school fee (in Rs): | 30−60 | 60−90 | 90−120 | 120−150 | 150−180 | 180−210 | 210−240 |
| Number of schools: | 5 | 12 | 14 | 18 | 10 | 9 | 4 |
Draw a histogram for the daily earnings of 30 drug stores in the following table:
| Daily earnings (in Rs): | 450−500 | 500−550 | 550−600 | 600−650 | 650−700 |
| Numbers of stores: | 16 | 10 | 7 | 3 | 1 |
Draw a histogram to represent the following data:
| Monthly salary (in Rs) | Number of teachers |
| 5600−5700 | 8 |
| 5700−5800 | 4 |
| 5800−5900 | 3 |
| 5900−6000 | 5 |
| 6000−6100 | 2 |
| 6100−6200 | 3 |
| 6200−6300 | 1 |
| 6300−6400 | 2 |
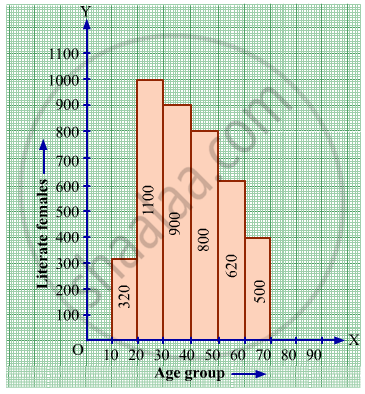
The following histogram shows the number of literate females in the age group of 10 to 40 years in a town:
(i) Write the age group in which the number of literate female is the highest.
(ii) What is the class width?
(iii) What is the lowest frequency?
(iv) What are the class marks of the classes?
(v) In which age group literate females are the least?
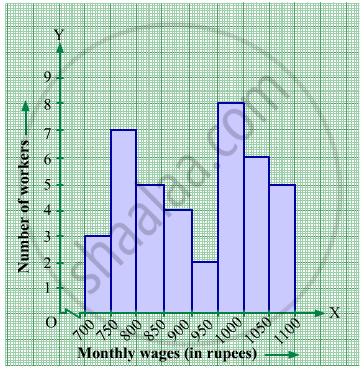
The following histogram shows the monthly wages (in Rs) of workers in a factory:
(i) In which wage-group the largest number of workers are being kept? What is their number?
(ii) What wages are the least number of workers getting? What is the number of such workers?
(iii) What is the total number of workers?
(iv) What is the factory size?
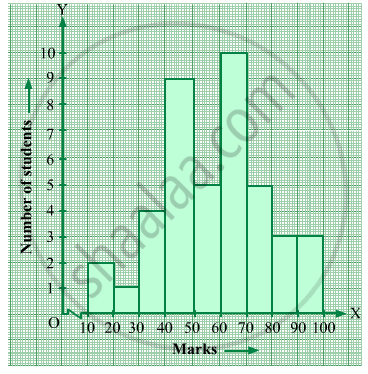
Below is the histogram depicting marks obtained by 43 students of a class:
(i) Write the number of students getting the highest marks.
(ii) What is the class size?
The following histogram shows the frequency distribution f the ages of 22 teachers in a school:
(i) What is the number of eldest and youngest teachers in the school?
(ii) Which age group teachers are more in the school and which least?
(iii) What is the size of the classes?
(iv) What are the class marks of the classes?
The weekly wages (in Rs.) of 30 workers in a factory are given:
830, 835, 890, 810, 835, 836, 869, 845, 898, 890, 820, 860, 832, 833, 855, 845, 804, 808, 812, 840, 885, 835, 835, 836, 878, 840, 868, 890, 806, 840
Mark a frequency table with intervals as 800-810, 810-820 and so on, using tally marks. Also, draw a histogram and answer the following questions:
(i) Which group has the maximum number of workers?
(ii) How many workers earn Rs 850 and more?
(iii) How many workers earn less than Rs 850?
Solutions for 24: Data Handling-II (Graphical Representation of Data as Histograms)
![RD Sharma solutions for Mathematics [English] Class 8 chapter 24 - Data Handling-II (Graphical Representation of Data as Histograms) RD Sharma solutions for Mathematics [English] Class 8 chapter 24 - Data Handling-II (Graphical Representation of Data as Histograms) - Shaalaa.com](/images/9788189928049-mathematics-english-class-8_6:d71f9951bde04f9981d965449678818b.jpg)
RD Sharma solutions for Mathematics [English] Class 8 chapter 24 - Data Handling-II (Graphical Representation of Data as Histograms)
Shaalaa.com has the CBSE Mathematics Mathematics [English] Class 8 CBSE solutions in a manner that help students grasp basic concepts better and faster. The detailed, step-by-step solutions will help you understand the concepts better and clarify any confusion. RD Sharma solutions for Mathematics Mathematics [English] Class 8 CBSE 24 (Data Handling-II (Graphical Representation of Data as Histograms)) include all questions with answers and detailed explanations. This will clear students' doubts about questions and improve their application skills while preparing for board exams.
Further, we at Shaalaa.com provide such solutions so students can prepare for written exams. RD Sharma textbook solutions can be a core help for self-study and provide excellent self-help guidance for students.
Concepts covered in Mathematics [English] Class 8 chapter 24 Data Handling-II (Graphical Representation of Data as Histograms) are Graphical Representation of Data as Histograms, Organisation of Data, Concept of Data Handling, Drawing a Bar Graph, Drawing a Double Bar Graph, Interpretation of a Double Bar Graph, Frequency Distribution Table, Concept of Pie Graph (Or a Circle-graph), Interpretation of Pie Diagram, Chance and Probability - Chance, Interpretation of a Pictograph, Interpretation of Bar Graphs, Basic Ideas of Probability.
Using RD Sharma Mathematics [English] Class 8 solutions Data Handling-II (Graphical Representation of Data as Histograms) exercise by students is an easy way to prepare for the exams, as they involve solutions arranged chapter-wise and also page-wise. The questions involved in RD Sharma Solutions are essential questions that can be asked in the final exam. Maximum CBSE Mathematics [English] Class 8 students prefer RD Sharma Textbook Solutions to score more in exams.
Get the free view of Chapter 24, Data Handling-II (Graphical Representation of Data as Histograms) Mathematics [English] Class 8 additional questions for Mathematics Mathematics [English] Class 8 CBSE, and you can use Shaalaa.com to keep it handy for your exam preparation.
