Advertisements
Advertisements
प्रश्न
Define an indifference map. Why does indifference curve to the right show more utility? Explain.
उत्तर
Indifference map is a family or collection of indifference curves that depicts the different levels of satisfaction and preferences of a consumer. Each indifference curve in an indifference map depicts a particular level of satisfaction.
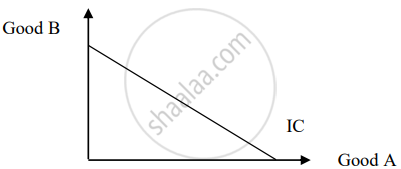
A rightmost indifference curve represents the highest utility derived from the joint consumption of two goods. The highest utility implies that the consumer is able to fetch the maximum possible satisfaction level as he is able to consume more of both the goods. That is, farther the IC from the origin, higher is the level of utility for the consumer.

The above figure depicts an Indifference Map comprising of six indifference curves (from IC1 to IC6). As the consumer moves farther away from IC1 to higher indifference curves the level of satisfaction derived by the consumer increases. For example, on IC2, the consumer is consuming 5 units of good 1 and 2 units of good 2 . As compared to this on the higher indifference curve, IC6, the consumer is able to consume 8 units of good 1 and 5 units of good 2. Thus, IC6 represents higher utility than IC2.
APPEARS IN
संबंधित प्रश्न
Explain the conditions of consumer’s equilibrium using indifference curve analysis.
Explain the three properties of the indifference curves.
Explain why an indifference curve is downward sloping from left to right.
State the meaning and properties of production possibilities frontier.
Why is an indifference curve negatively sloped? Explain.
If Marginal Rate of Substitution is constant throughout, the Indifference curve will be :(choose the correct alternative)
a. Parallel to the x-axis.
b. Downward sloping concave.
c. Downward sloping convex.
d. Downward sloping straight line.
Define indifference map.
A consumer consumes only two goods. If the price of one of the goods falls, the indifference curve: (Choose the correct alternative)
a. Shifts upwards
b. Shifts downwards
c. Can shift both upwards or downwards
d. Does not shift
Explain why is an indifference curve is Convex.
Read the following passage and answer the question that follows:
| The ordinal list revolution originates in the criticism of the psychological foundations of the theory of demand, namely, the principle of decreasing marginal utility as Alfred Marshall ([1890] 1898) used it. The rejection of hedonist hypotheses led Irving Fisher (1892) and Pareto (1896-97, 1900, 1909) to favour an objective or "positive" approach to economic concepts. The "ordinal list revolution" (Omarzabal 1995, 116) is grounded in a methodological transformation of economics that put the facts of objective experience as a foundation of economics and provided a research program for the ensuing years (Green and Moss 1993; Lewin 1996). Mathematically, ordinalism is entirely based upon the idea that one can dispense with the use of a specific utility function and that no meaning shall be attached to utility measurement, except as an ordinal principle. Clearly, the development of ordinalism must be separated from the introduction of the concept of the indifference curve. Ordinalism was first advocated in Fisher's "Mathematics Investigations" (1892) and Pareto's Sunto (1900) and Manual ([1909] 1971), while the indifference curve had appeared in F. Y. Edge Worth's Mathematical Psychics (1881). It was thus only through Fisher's and Pareto's recasting that the concept of the indifference curve became irreversibly associated with the promotion of ordinalism. Along the way, the recasting of the theory of choice along ordinal list lines raised a number of issues (about integrability, measurability, and complementarity) that would be progressively settled. The reasonable closing date for the ordinalist revolution is 1950, after Houthakker's (1950) and Samuelson's (1950) contributions. From the late 1920s, the Paretian school was progressively gaining a larger audience while the use of the concept of marginal utility and other derivative concepts was challenged. Consequently, demand theory was recast along with the principles of individual preferences and ordinal utility functions. Nevertheless, English authors proved very silent about the meaning of indifference curves. Most if not all of the reflections after 1920 about the nature of indifference curves took place in America, mainly under the impulse of Henry Schultz at Chicago. This is an American story. |
How is utility measured in Ordinal utility theory?
Assertion (A): A lower indifference curve represents a higher level of satisfaction.
Reason (R): According to the Indifference Curve Approach, utility is an ordinal concept, that is, it can be ranked and not measured.
Which of these is not a property of indifference curve?
Indifference curve is:
Which of the following is an assumption for Indifference Curve Approach.
Which of the following statements are incorrect?
Will you defend or refute the case depicted in the following diagram? Provide a rationale in support of your view.