Advertisements
Advertisements
प्रश्न
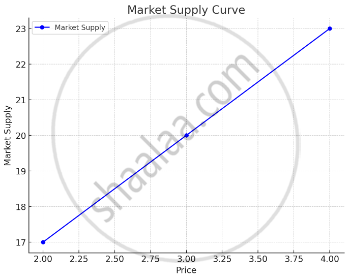
Derive market supply schedule and curve from the following hypothetical individual supply schedules of two firms A and B.
| Price | SA | SB |
| 2 | 10 | 7 |
| 3 | 12 | 8 |
| 4 | 14 | 9 |
With the help of a hypothetical supply schedule, draw a supply curve.
उत्तर

| Price | SA | SB | Market Supply (SA + SB) |
| 2 | 10 | 7 | 17 |
| 3 | 12 | 8 | 20 |
| 4 | 14 | 9 | 23 |
APPEARS IN
संबंधित प्रश्न
Derive the market supply from the market supply schedule of two firms A and B.
| Price | Firm A | Firm B | Ms |
| 2 | 10 | 7 | ? |
| 3 | 12 | 8 | ? |
| 4 | 14 | 9 | ? |
| 5 | 16 | 11 | ? |
| 6 | 18 | 13 | ? |
What are the values of (i), (ii) and (iii). Assume that there are only 3 firms in the market.
| Price (in ₹) | Firm A (units) | Firm B (units) | Firm C (units) | Market supply (units) |
| 10 | 0 | 25 | 10 | 35 |
| 20 | 10 | 30 | (ii) | 60 |
| 30 | (i) | 35 | 25 | 80 |
| 40 | 30 | 40 | 40 | (iii) |
| 50 | 40 | 45 | 50 | 135 |
The given supply schedule represents ______.
| Price (₹) | 20 | 20 |
| Supply (Units) | 100 | 120 |
What are the values of (i) and (ii)
Market Supply Schedule (Supposing that there are only 2 firms - A and B in the market)
| Price (₹) | Quantity Supplied | ||
| By A | By B | Market | |
| 4 | 10,000 | 6,000 | (ii) ______ |
| 5 | 12,000 | 10,000 | 22,000 |
| 6 | 15,000 | (i) ______ | 30,000 |
| 7 | 18,000 | 20,000 | 38,000 |
| 8 | 20,000 | 25,000 | 45,000 |
Construct an imaginary individual supply schedule. Draw an individual supply curve based on an imaginary individual supply schedule.
There are three identical firms in a market. The following table shows the supply schedule of firm 1. Compute the market supply schedule.
| Price (₹ per unit): | 0 | 1 | 2 | 3 | 4 | 5 | 6 | 7 | 8 |
| Supply (units): | 0 | 0 | 2 | 4 | 6 | 8 | 10 | 12 | 14 |
How is a market supply schedule attained from individual supply schedules of a commodity?
What is a supply schedule?
What is market supply?
With the help of a hypothetical supply schedule, draw a supply curve.
