Advertisements
Advertisements
प्रश्न
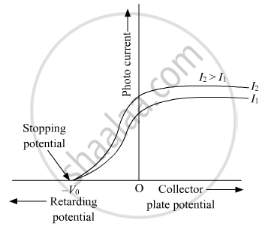
Draw graphs showing variation of photoelectric current with applied voltage for two incident radiations of equal frequency and different intensities. Mark the graph for the radiation of higher intensity.
उत्तर
APPEARS IN
संबंधित प्रश्न
Write nuclear reaction equation for α-decay of `""_94^242"Pu"`.
Write nuclear reaction equation for β+-decay of `""_6^11"C"`.
Plot a graph showing variation of activity of a given radioactive sample with time.
The sequence of stepwise decay of a radioactive nucleus is
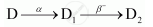
If the atomic number and mass number of D2 are 71 and 176 respectively, what are their corresponding values of D?
Radioactive 131I has a half-life of 8.0 days. A sample containing 131I has activity 20 µCi at t = 0. (a) What is its activity at t = 4 days? (b) What is its decay constant at t = 4.0 days?
In an agricultural experiment, a solution containing 1 mole of a radioactive material (t1/2= 14.3 days) was injected into the roots of a plant. The plant was allowed 70 hours to settle down and then activity was measured in its fruit. If the activity measured was 1 µCi, what per cent of activity is transmitted from the root to the fruit in steady state?
A charged capacitor of capacitance C is discharged through a resistance R. A radioactive sample decays with an average-life τ. Find the value of R for which the ratio of the electrostatic field energy stored in the capacitor to the activity of the radioactive sample remains constant in time.
A sample contains a mixture of 108Ag and 110Ag isotopes each having an activity of 8.0 × 10⁸ disintegration per second. 110Ag is known to have larger half-life than 108Ag. The activity A is measured as a function of time and the following data are obtained.
| Time (s) |
Activity (A) (108 disinte- grations s−1) |
Time (s) |
Activity (A 108 disinte-grations s−1) |
| 20 40 60 80 100 |
11.799 9.1680 7.4492 6.2684 5.4115 |
200 300 400 500 |
3.0828 1.8899 1.1671 0.7212 |
(a) Plot ln (A/A0) versus time. (b) See that for large values of time, the plot is nearly linear. Deduce the half-life of 110Ag from this portion of the plot. (c) Use the half-life of 110Ag to calculate the activity corresponding to 108Ag in the first 50 s. (d) Plot In (A/A0) versus time for 108Ag for the first 50 s. (e) Find the half-life of 108Ag.
In a gamma ray emission from nucleus :
Complete the following nuclear reactions :
(i) `"_15^32P -> ` `"_z^AX + bar(e) + bar(v)`
(ii) `"_6^12 C `+`"_6^12C ->` ` "_2^A Y + ` `"_4^2 He`
