Advertisements
Advertisements
प्रश्न
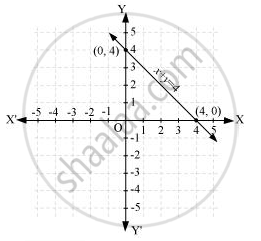
Draw the graph of the following linear equation in two variables:
x + y = 4
उत्तर
It can be observed that x = 0, y = 4 and x = 4, y = 0 are solutions of the above equation. Therefore, the solution table is as follows.
Here, x + y = 4
Substituting the values for x,
When x = 0,
x + y = 4
0 + y = 4
∴ y = 4
When x = 4,
x + y = 4
4 + y = 4
y = 4 – 4
∴ y = 0
| x | 0 | 4 |
| y | 4 | 0 |
The graph of this equation is constructed as follows.
APPEARS IN
संबंधित प्रश्न
Draw the graph of the following linear equation in two variable : –x + y = 6
Draw the graph for the equation, given below :
x - 5y + 4 = 0
Use graph paper for this question. Take 2 cm = 2 units on x-axis and 2 cm = 1 unit on y-axis.
Solve graphically the following equation:
3x + 5y = 12; 3x - 5y + 18 = 0 (Plot only three points per line)
Use graph paper for this question. Take 2 cm = 1 unit on both the axes.
- Draw the graphs of x + y + 3 = 0 and 3x - 2y + 4 = 0. Plot only three points per line.
- Write down the coordinates of the point of intersection of the lines.
- Measure and record the distance of the point of intersection of the lines from the origin in cm.
Draw the graphs of the following linear equations:
x = 3
Draw the graph for the following
3x + 2y = 14
y = px where p ∈ Z always passes through the _________
Draw the graph of the following equation:
x = – 7
Draw the graph of the following equation:
y = 6
Find the values.
y = x + 3
| x | 0 | − 2 | ||
| y | 0 | − 3 |
