Advertisements
Advertisements
प्रश्न
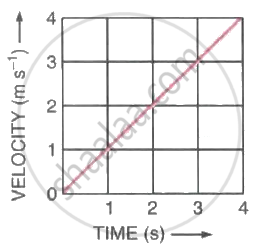
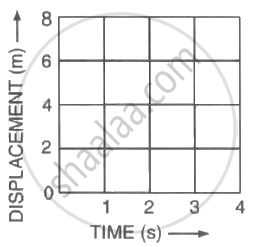
Figure (a) shows the velocity-time graph for the motion of a body. Use it to find the displacement of the body at t = 1 s, 2 s, 3 s and 4 s, then draw on Figure (b), the displacement-time graph for it.
 |
 |
| (a) | (b) |
उत्तर
Let displacements at t = 1 s, 2 s, 3 s, 4 s be S1, S2, S3, S4 respectively.
At t = 1 s, displacement S1 = `1/2 xx 1 xx 1` = 0.5 m
At t = 2 s, displacement S2 = `1/2 xx 2 xx 2` = 2 m
At t = 3 s, displacement S3 = `1/2 xx 3 xx 3` = 4.5 m
At t = 4 s, displacement S4 = `1/2 xx 4 xx 4` = 8 m
The table below gives the displacement of body at different instants.
| Time (in s) | 1 | 2 | 3 | 4 |
| Displacement (in m) | 0.5 | 2 | 4.5 | 8 |
The displacement time graph is shown below

APPEARS IN
संबंधित प्रश्न
If on a round trip you travel 6 km and then arrive back home :
What is your final displacement ?
The numerical ratio of displacement to distance for a moving object is :
State how the velocity-time graph can be used to find The distance travelled by the body in a given time
Define Distance.
A car covers 90 km in `1 1/2` hours towards east. Calculate
- displacement of car,
- its velocity in (a) kmh−1 (b) ms−1.
A body moves along a circular path of radius r. When it completes three complete rounds, what is the ratio of distance covered to its displacement?
The displacement is zero when the initial and final positions are ______.
A body moves is a circle of radius ‘2R’ what is the distance covered and displacement of the body after 2 complete rounds?
Write a note on the following:
Nautical mile
A particle is moving in a circular pattern of radius r. The displacement after half a circle would be ______.
